Hello. Mr. Howard Diamond and all NOAA staff. [気候変動に関わるカテゴリー]
Hello. Mr. Howard Diamond and all NOAA staff
First of all, I would like to offer my utmost apologies for the delay in replying to your e-mail. We will ensure that this will not happen in the future.
This was a blunder caused by a mistake in my server settings
We email to NOAA was in the fall of 2022.
About 18 months have passed since then, and I have since discovered a number of core facts, and I am to report those facts to NOAA.
None of these facts would be something that a true scientist would be able to ignore.
Scientific Data Part 1
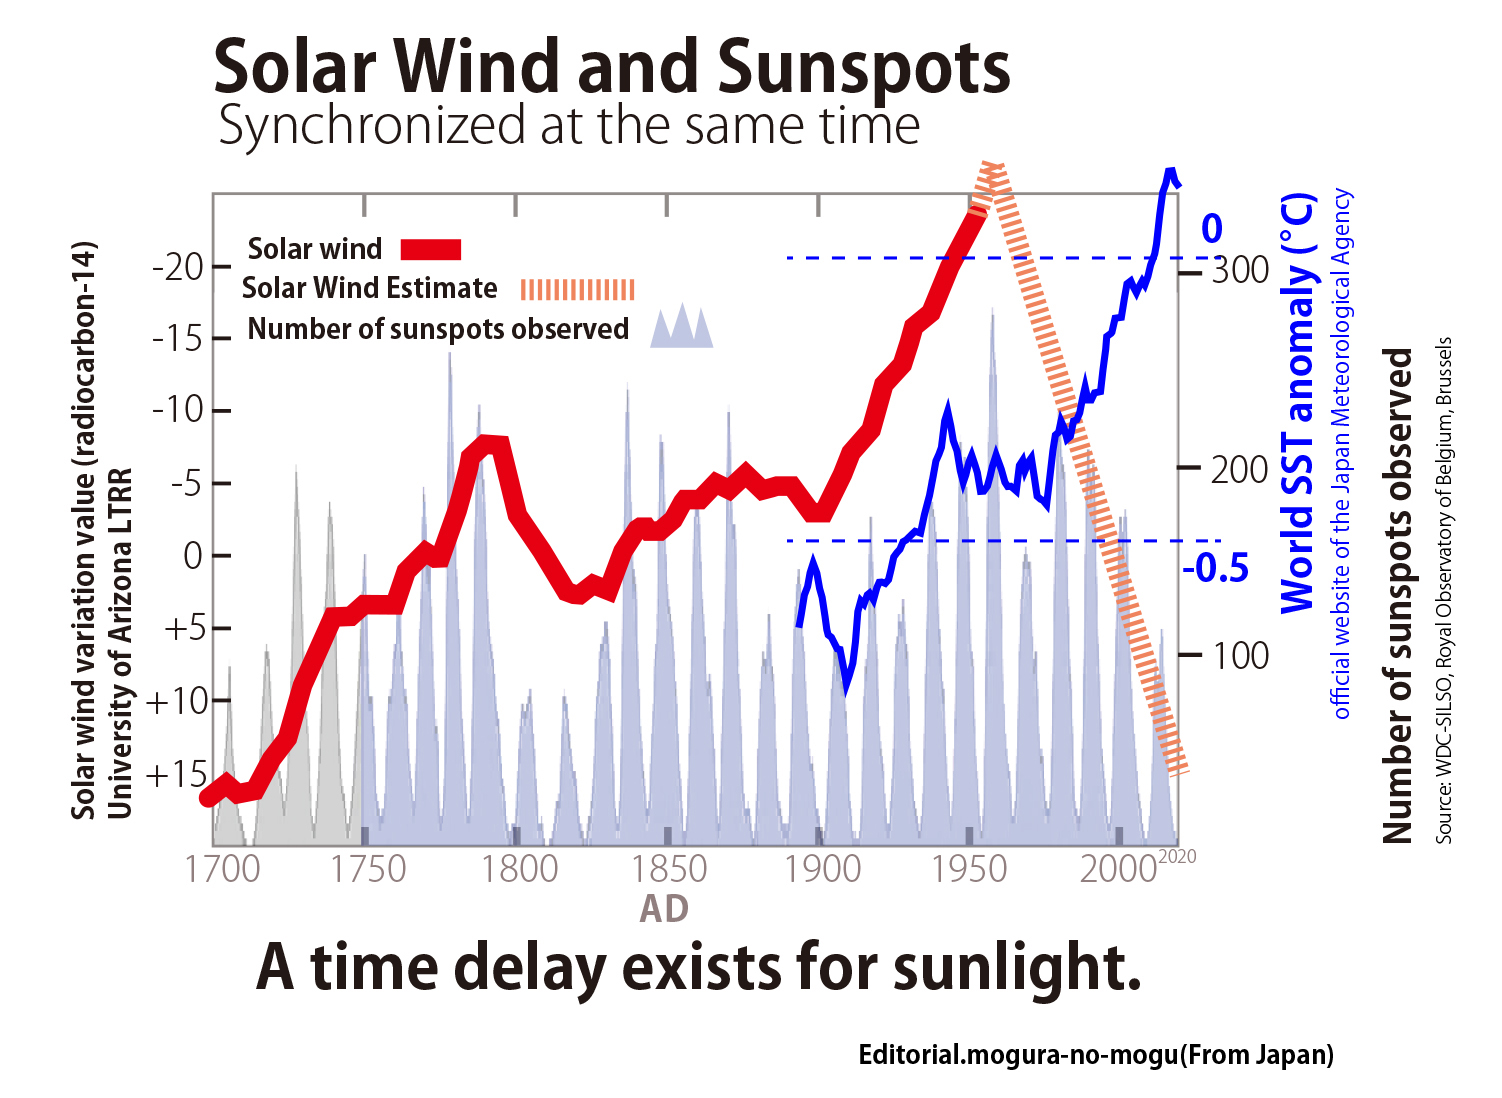
As shown in the figure above, there appears to be a time difference of about 60 years between solar wind and sunlight (solar radiation).
The IPCC calculated that the variation in solar activity is less than 0.1% and that the effect on temperature is less than 1°C, but this may be a misunderstanding in basic understanding.
Scientific Data Part 2
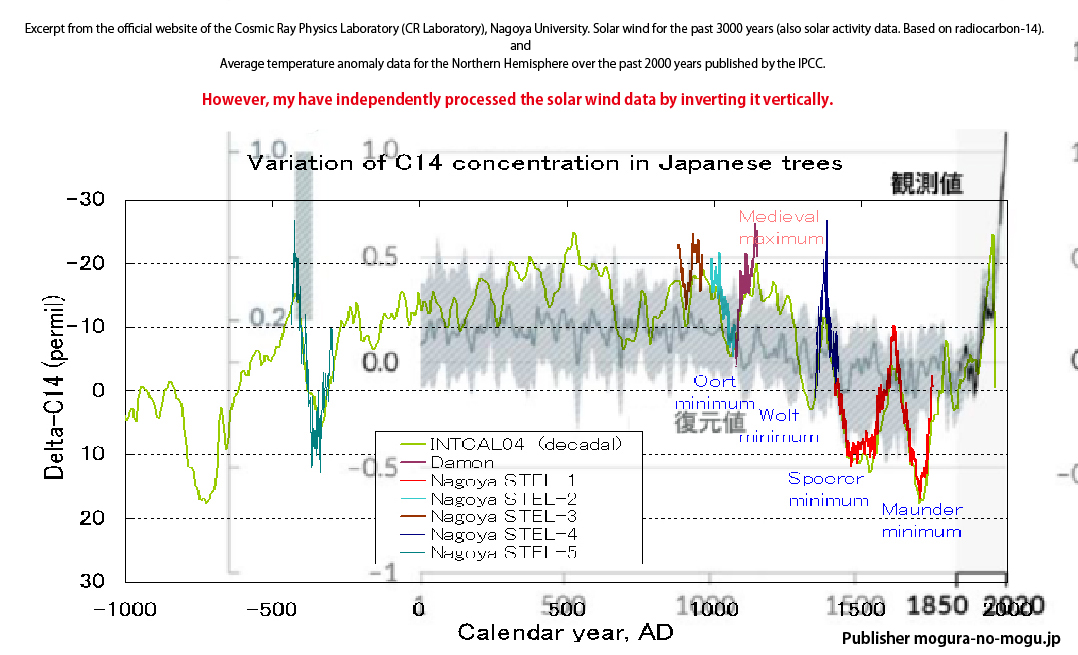
Excerpt from the official website of the Cosmic Ray Physics Laboratory (CR Laboratory), Nagoya University. Solar wind for the past 3000 years (also solar activity data. Based on radiocarbon-14).
Note that I have independently inverted the data up and down to match the average temperature data.
If you plot the data minus to the upper side and plus to the lower side, you can find the correlation with the average temperature data.
And,
Average temperature anomaly data for the Northern Hemisphere over the past 2000 years published by the IPCC.
Note that the solar wind radiation appears to have declined in the 1940s, but this decline was caused by the neutron radiation generated by the development of nuclear weapons by mankind.
In fact, it is inferred that the solar wind was rising rapidly until about 1958 or 1960 (inferred based on the number of sunspot observations).
Scientific Data Part 3
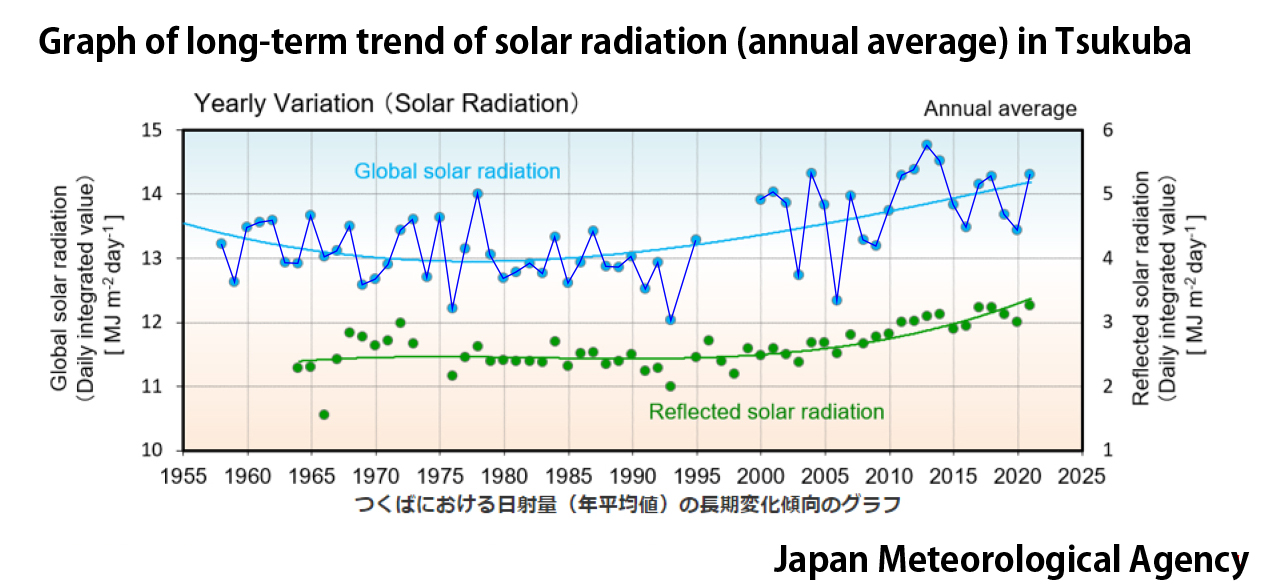
Sunlight (solar radiation) variation data. An example
Observation data at Tsukuba City, Japan Meteorological Agency
Scientific Data Part 4
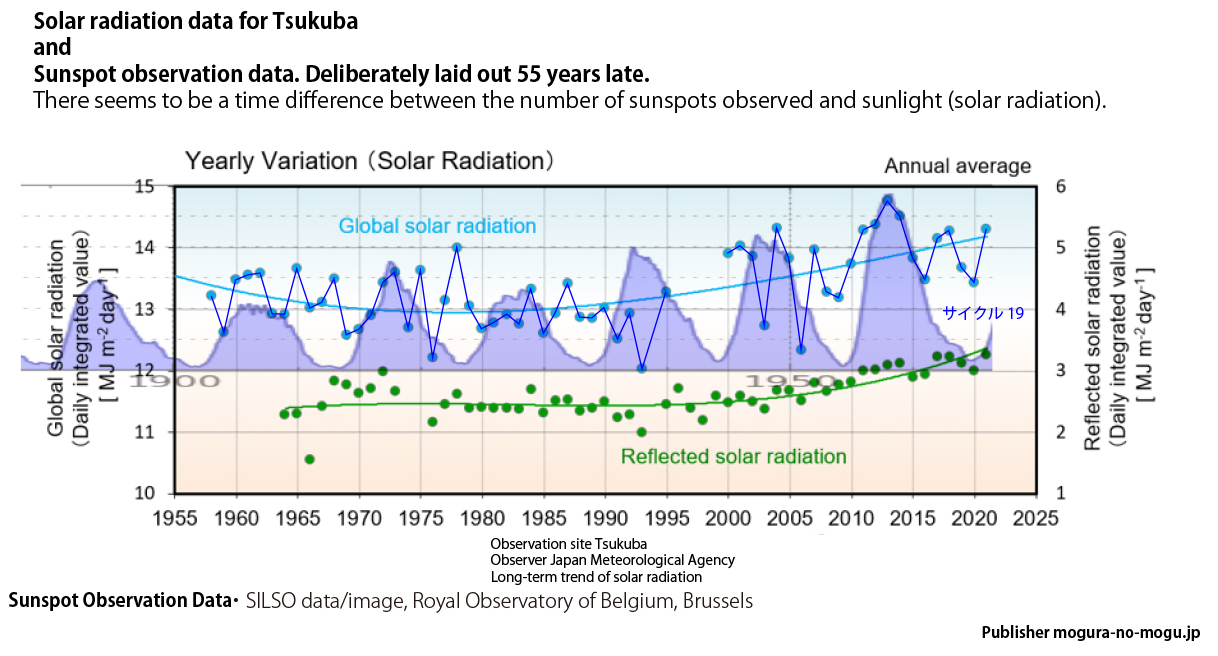
It is true that sunlight (solar radiation) is on an upward trend in many parts of the world.
However, there appears to be a time lag of about 55 years between sunspot observation data and sunlight (solar radiation) variations.
Figure 1:
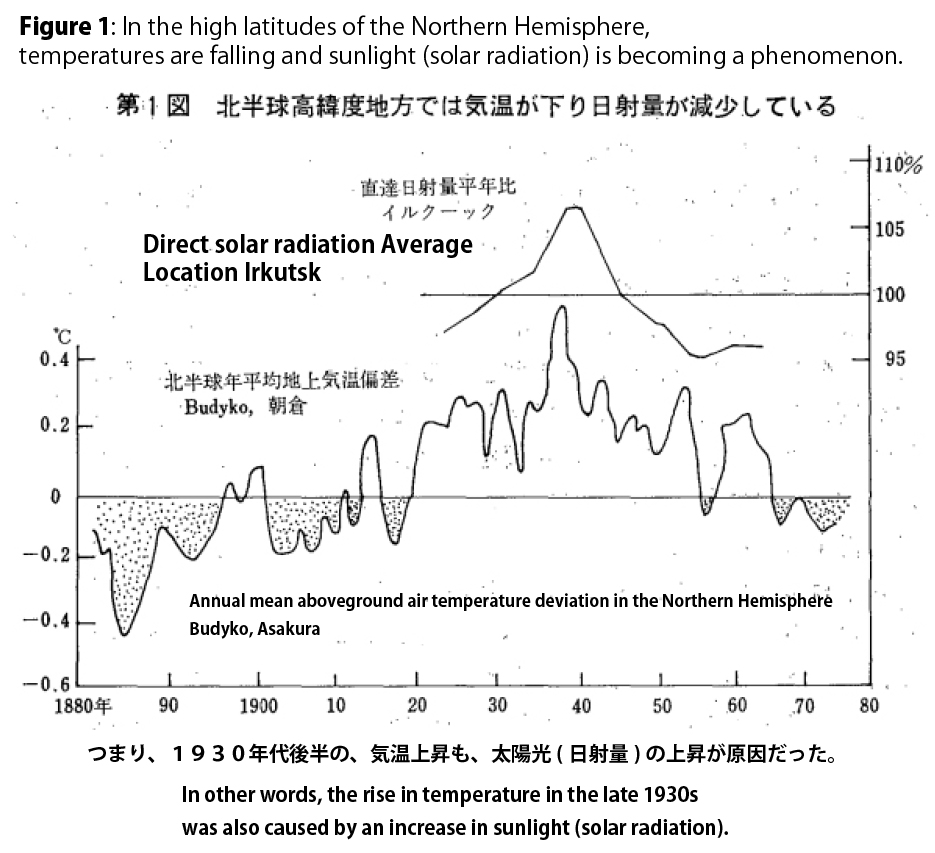
In the high latitudes of the Northern Hemisphere,
temperatures are falling and sunlight (solar radiation) is becoming a phenomenon.
The peak in the average temperature increase observed in the late 1930s was also brought about by fluctuations in sun light(solar radiation).
This is exactly the same principle behind the modern phenomenon of global warming.
Download URL
https://www.jcam-agri.co.jp/book/data/%E8%BE%B2%E6%A5%AD%E3%81%A8%E7%A7%91%E5%AD%A6%201975.01%E6%9C%88/1975%E5%B9%B401%E6%9C%88%E5 %8F%B7_%E5%A4%A7%E5%BE%8C%E7%BE%8E%E4%BF%9D_%E6%9C%80%E8%BF%91%E3%81%AE%E4%B8%96%E7%95%8C%E3%81%AE%E7%95%B0%E5%B8%B8%E6%B0%97%E8%B 1%A1%E3%81%A8%E8%BE%B2%E6%A5%AD.pdf
Title of Bibliography Recent World Extreme Weather and Agriculture
Author Yoshiyasu Daigo, President of the Society of Industrial Science and Technology and Doctor of Agriculture
Date of Publication January 1, 1975
Scientific Data Part 5
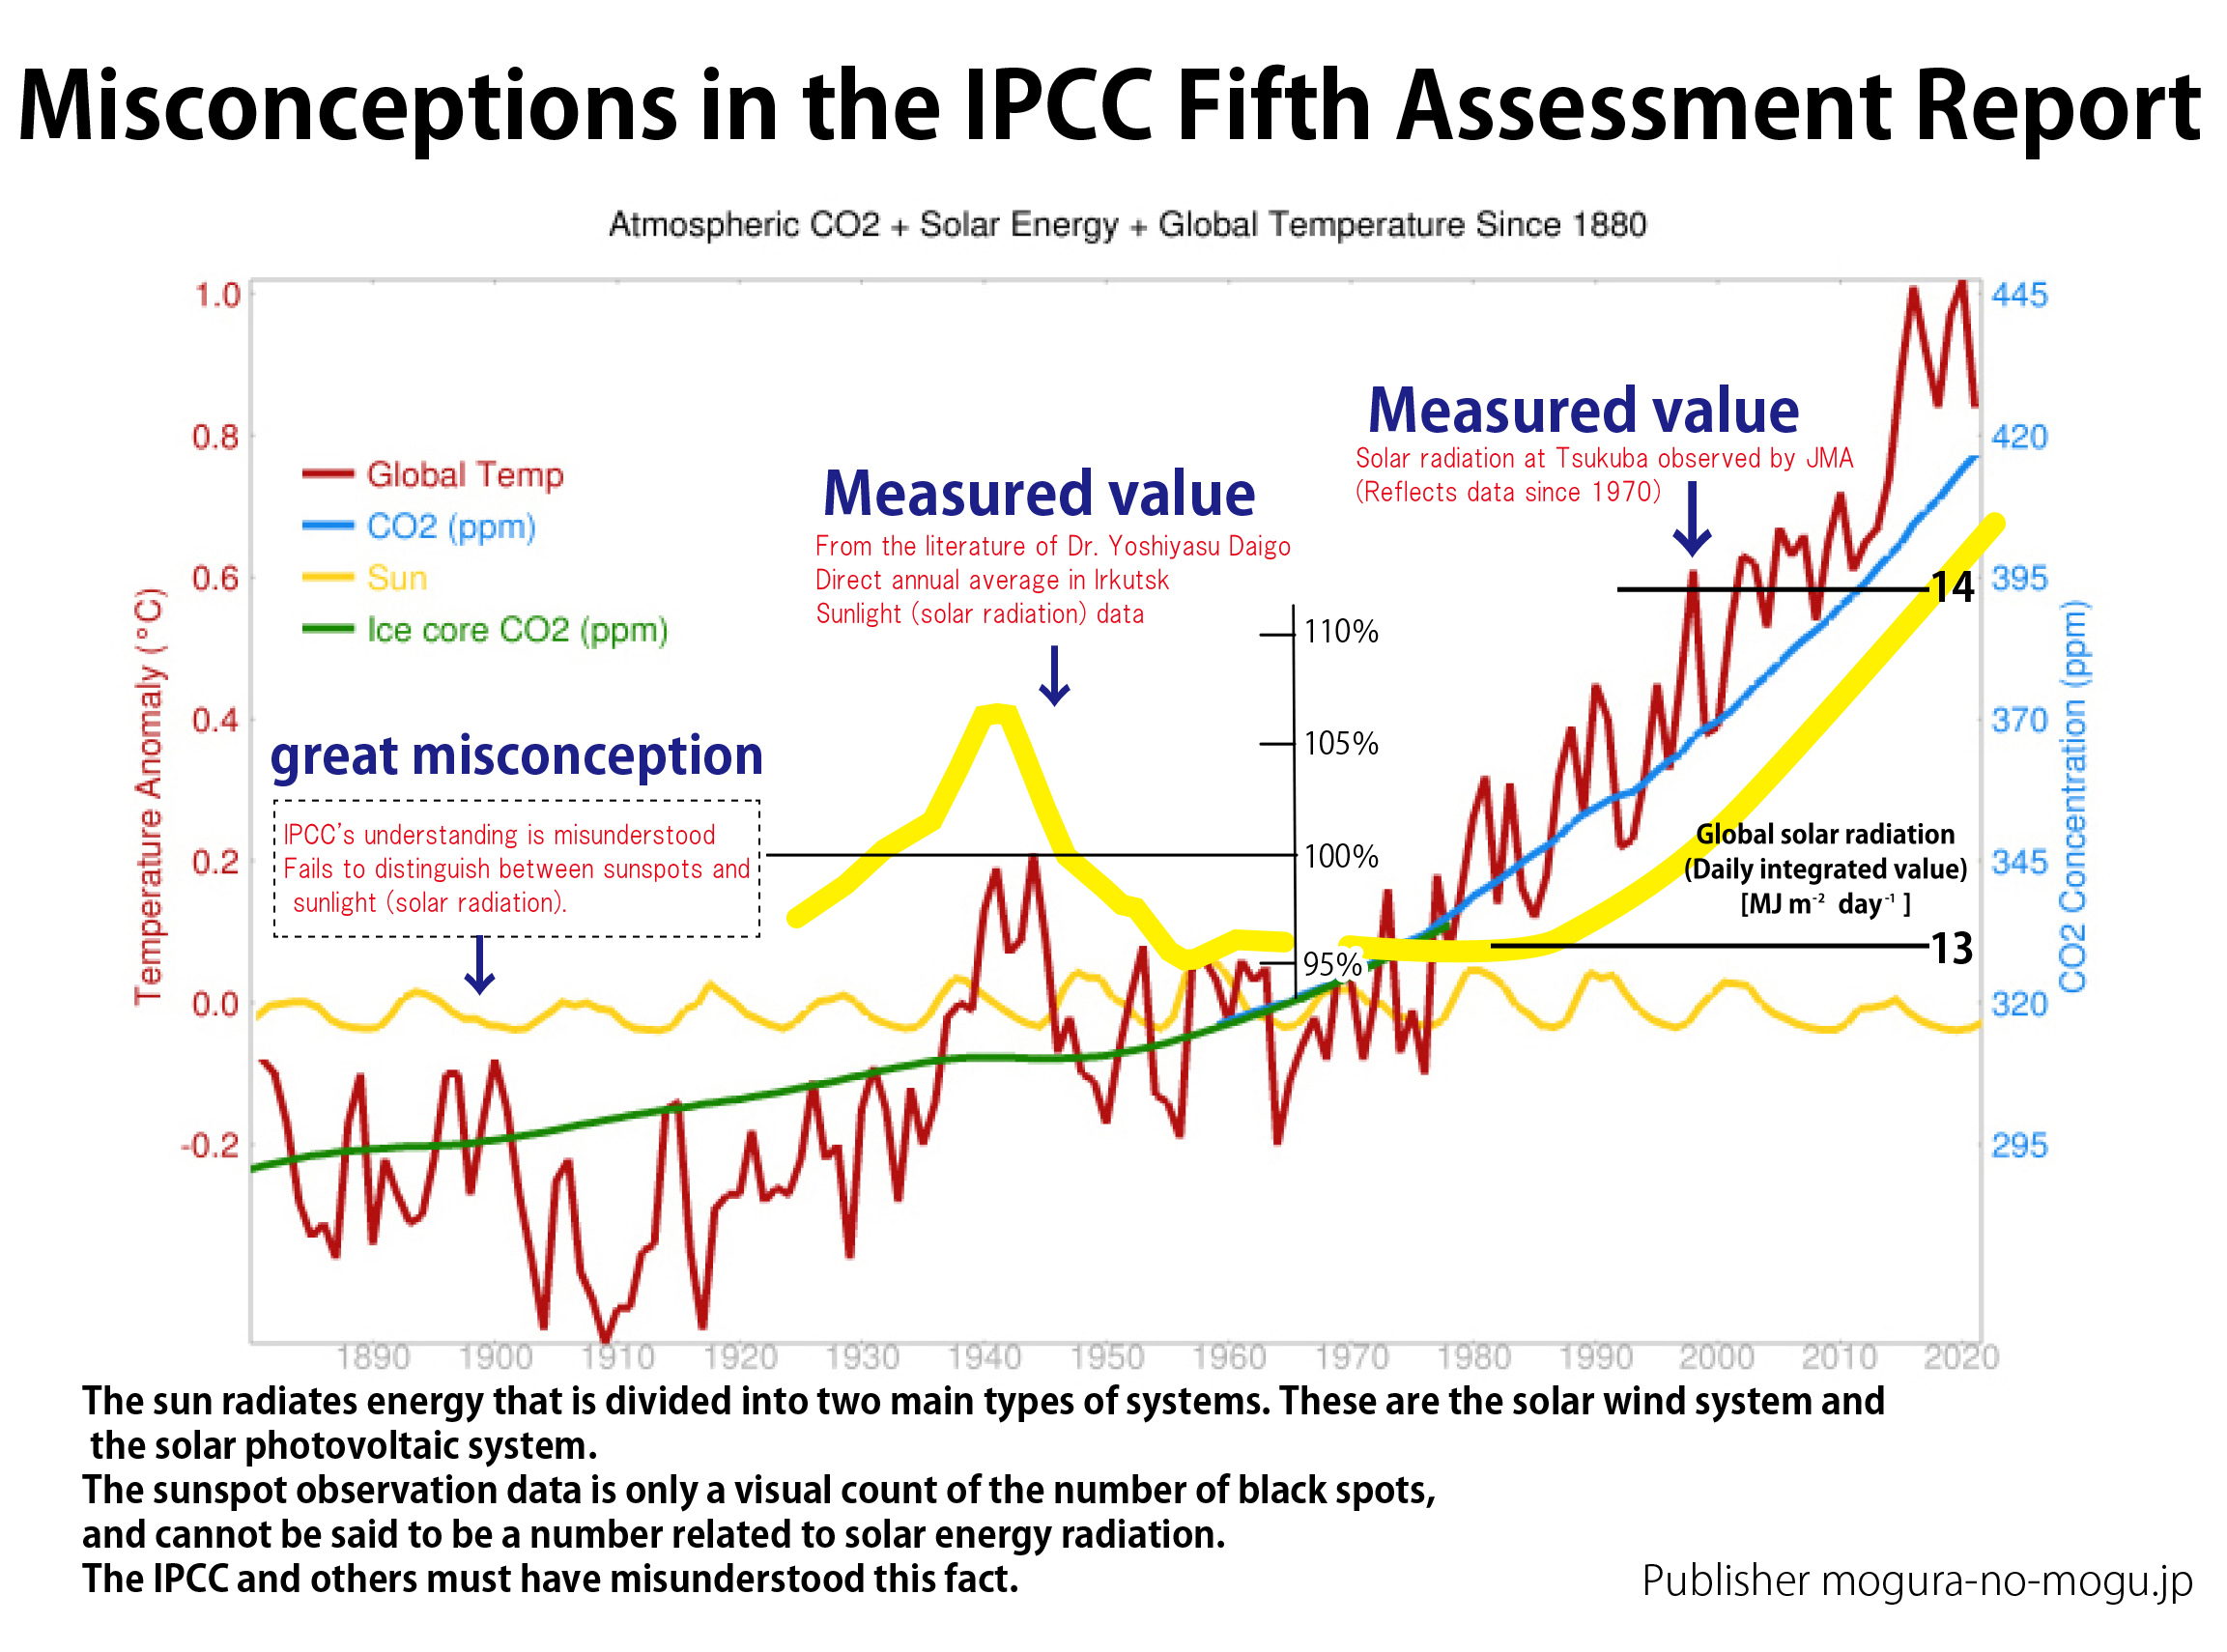
Mixing the two sets of data on sunlight (solar radiation) shows this.
At least since the 1920s, there has been a correlation between changes in sunlight (solar radiation) and changes in global average temperature.
The IPCC has many misconceptions, and no doubt it also misunderstands the distinction between sunspots and sunlight (solar radiation).
The sun radiates energy that is divided into two main types of systems. These are the solar wind system and the solar photovoltaic system.
The sunspot observation data is only a visual count of the number of black spots, and cannot be said to be a number related to solar energy radiation. The IPCC and others must have misunderstood this fact.


