We were the first to elucidate the cyclical nature of solar activity and temperature fluctuations. [もぐらのもぐ相対性理論]
We were the first to elucidate the cyclical nature of solar activity and temperature fluctuations.

Professor PaPa Mogu
(mogura-no-mogu.jp Solar Activity and Climate Change Research Project Team)
Hello to the world.
I'd like to say that we are not good at giving presentations in English. We are not very good at giving presentations in English, so please be patient with us if there are any misspellings.
Abstract
1. There is a definite periodicity in global temperature fluctuations.
2. In sync with this, solar activity also shows a periodicity.
3. It is important to note that the return points of the laws are in sync.
4. Common sense tells us that there is a periodicity in solar activity and a periodicity in global temperature fluctuations.
5. We will end briefly this time, but if you expand on this realization, you will discover a series of shocking facts.
6. It will greatly improve our understanding of sunspots. With the discovery of the solar wind cycle, we will discover the true meaning of the sunspot cycle.
In the Japanese version of this article, more details are discussed.
https://mogura-no-mogu.blog.ss-blog.jp/2021-09-15-mogu-ver4
I'm sorry to have to tell you this, but...
Common sense is always required to understand the following content.
The fact is that people diagnosed with Asperger's syndrome are not very good at understanding common sense.
In fact, when they hear obviously absurd stories such as the theory of anthropogenic global warming of CO2, what is the point of the absurdity? They don't seem to understand at all.
This time, I'm going to use common sense. It may be difficult for people with Asperger's to understand, but in such cases, please question your own senses instead of looking for the cause in the presenter.
The IPCC's presentations are always strange ...... Such points have been raised from all over the world, but perhaps it is because they are always presenting their own strange understandings that can be described as Aspergerian.......maybe.
Boogity,Boogity,Boogity,Now let's begin.
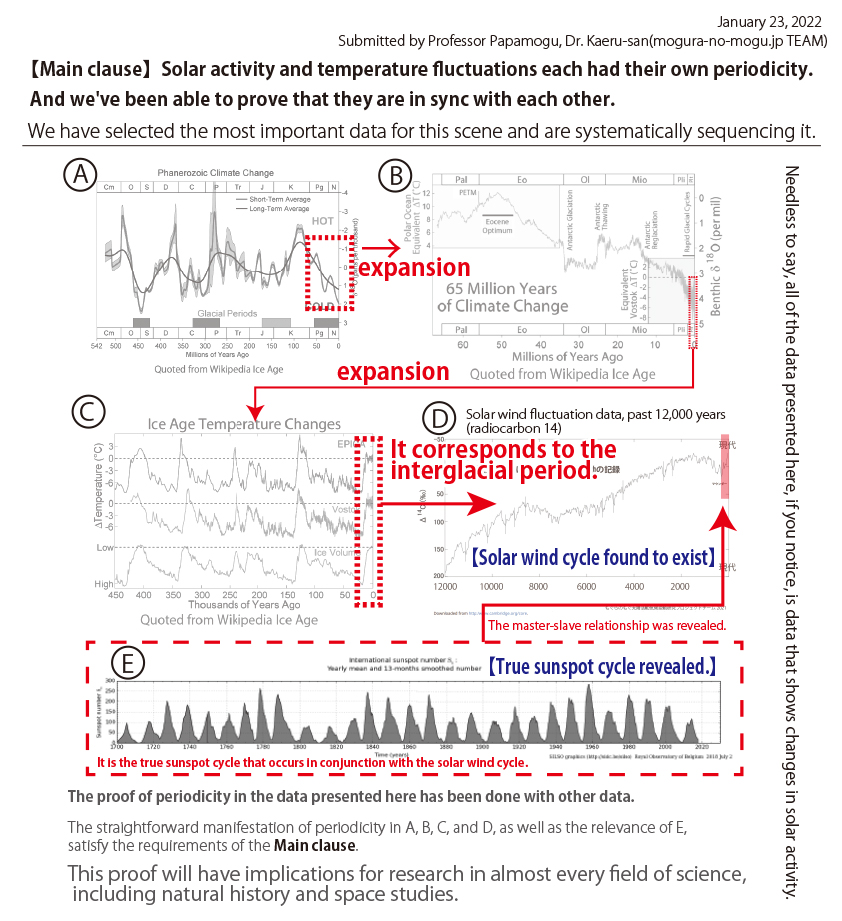
A and B
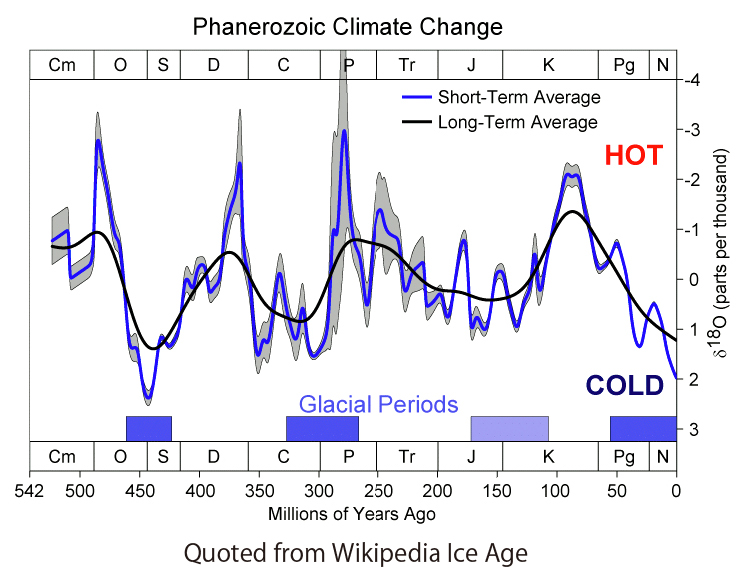
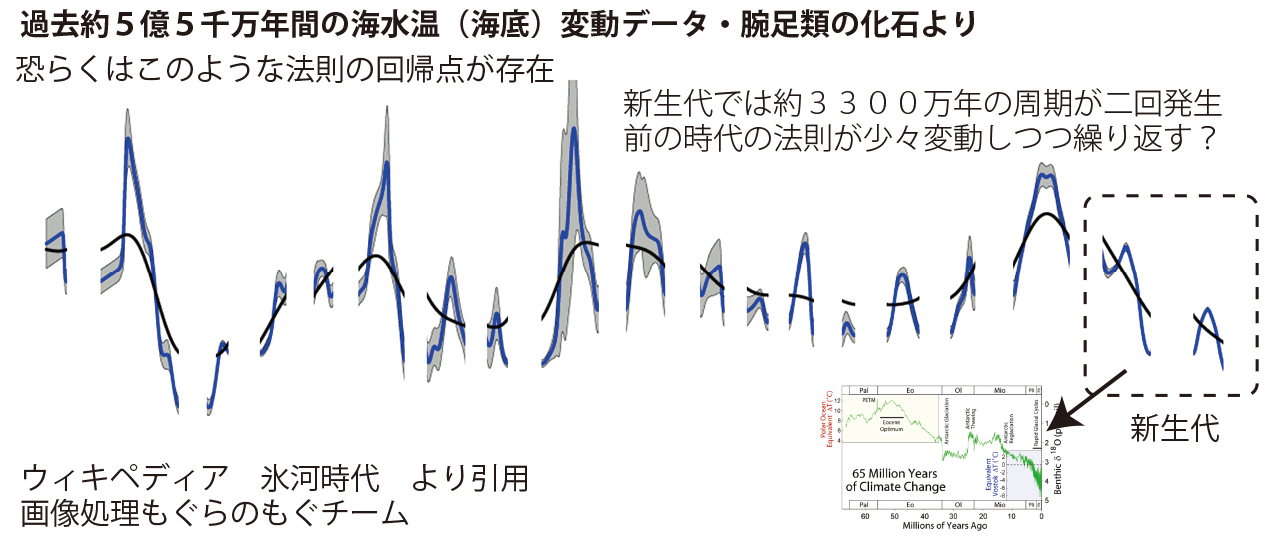
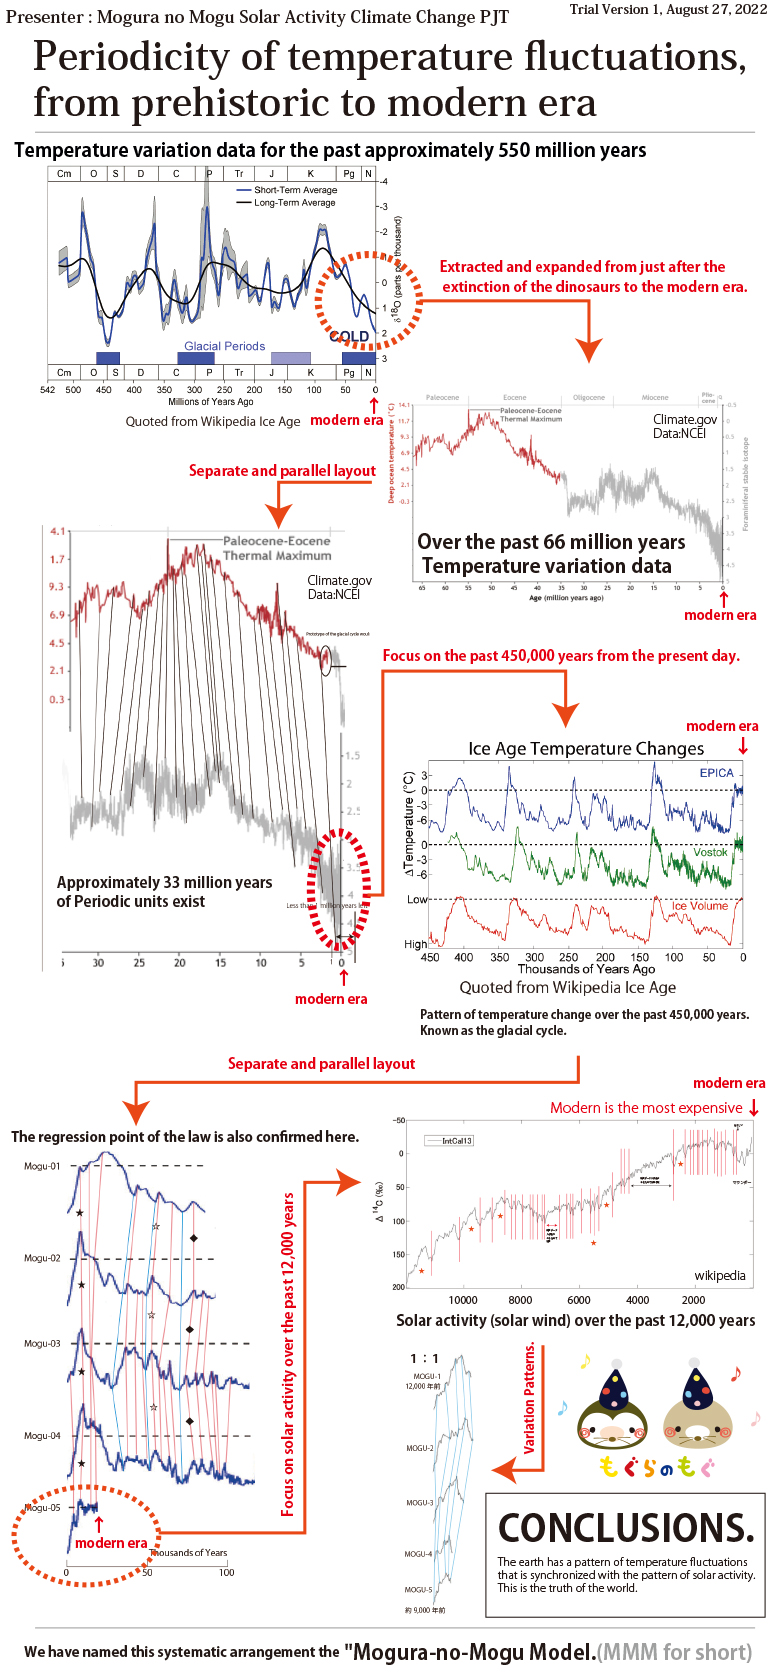
Global sea temperature variation data from oxygen 18 data contained in fossils, presented by Prof. Jan Weitzer's team at the University of Ottawa.
A is data for 550 million years, and B is data for 66 million years from the present to the past. Note that there are falsified data. There is no problem here.
B
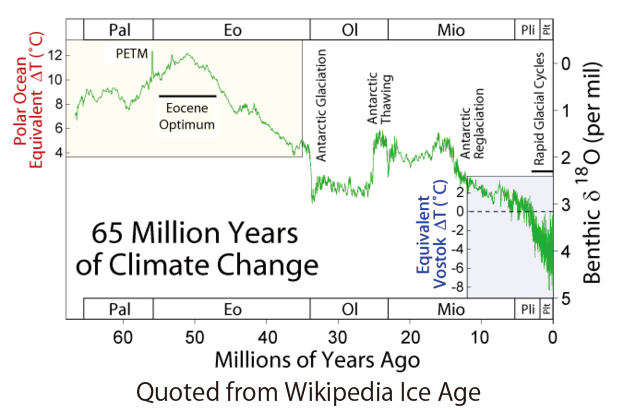
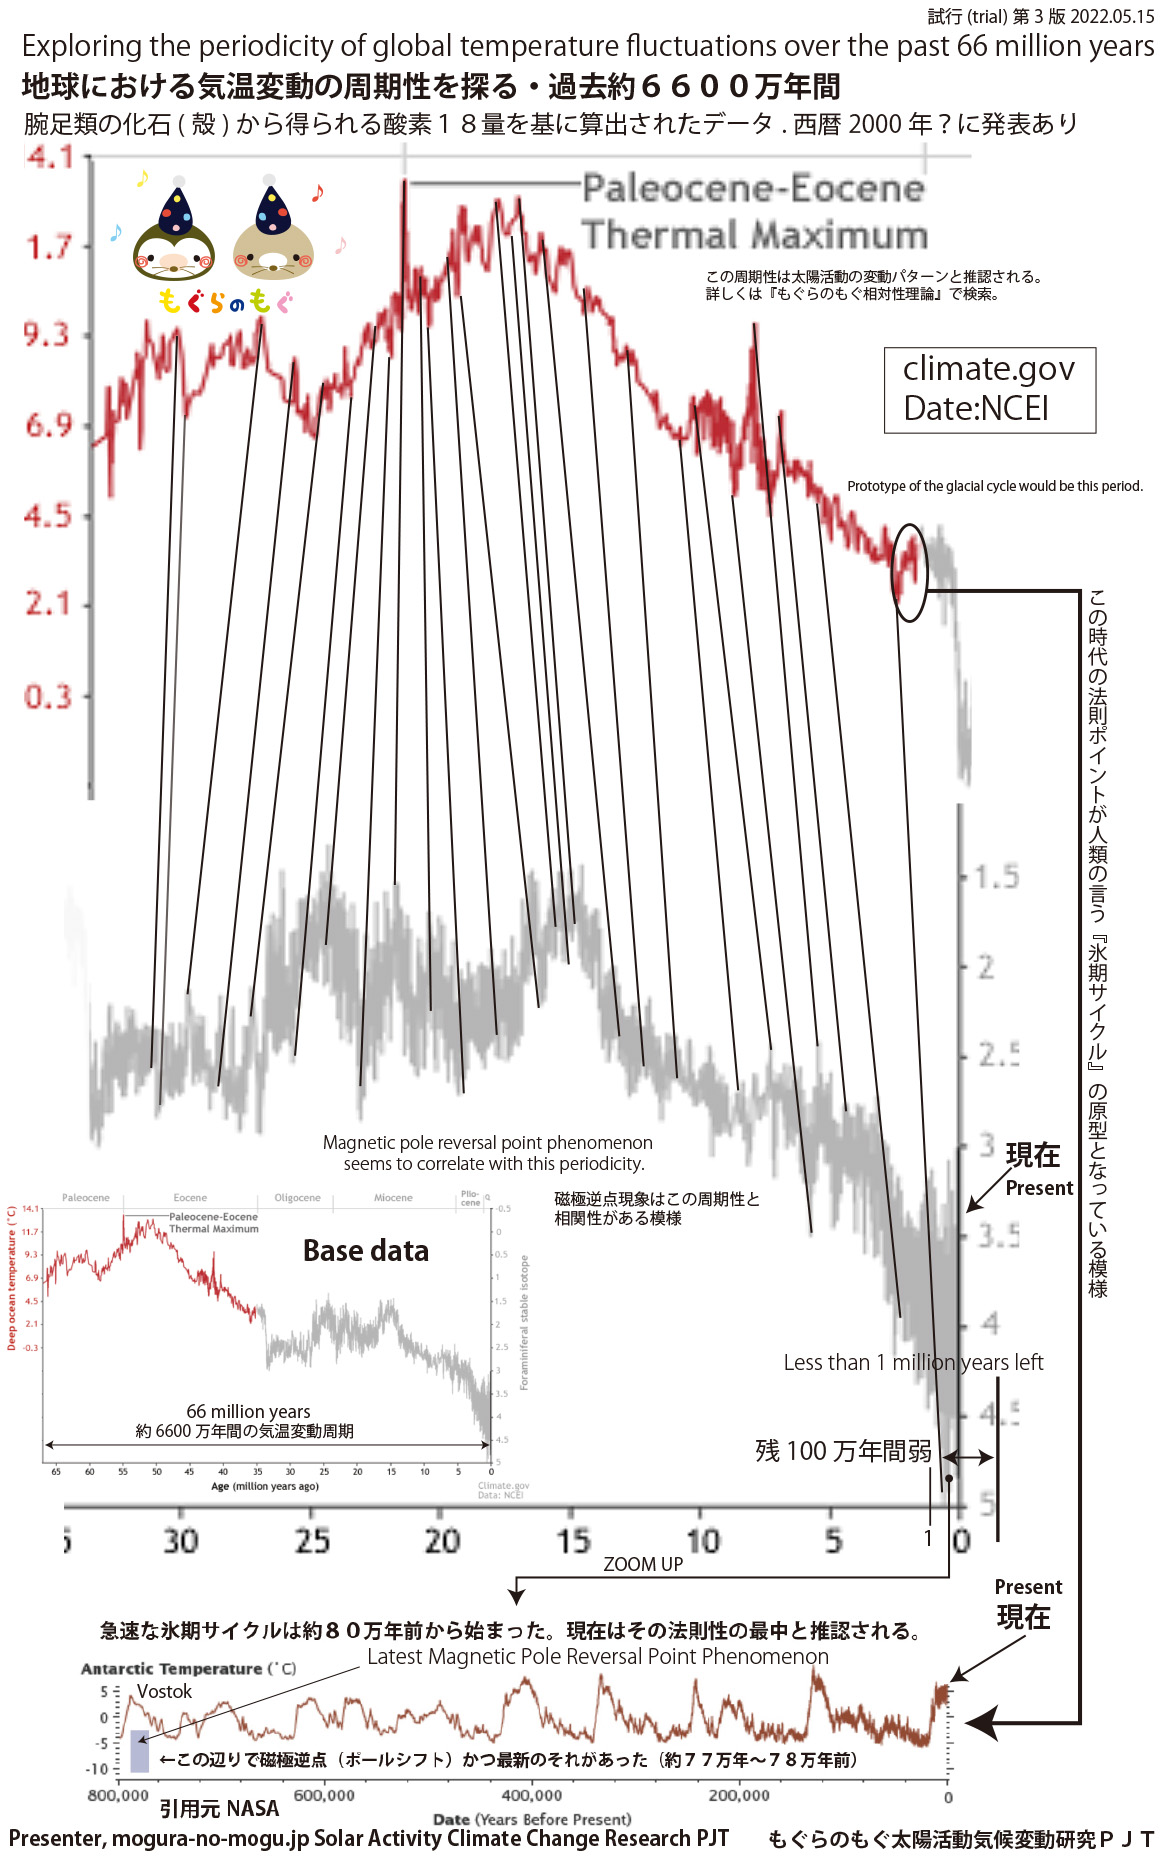
Don't just look at this data in a daze. If you notice the "law regression points," lay them out in parallel, and connect the similarities with a line, you will find this fact.
There is clearly a law and a periodicity in the variation of seawater temperature on Earth over the past 66 million years.
(This understanding seems to be difficult for those with Asperger's. As difficult as it may be for some people to understand, this is an obvious demonstration of common sense. I dare to mention this to avoid a sterile debate.)
C
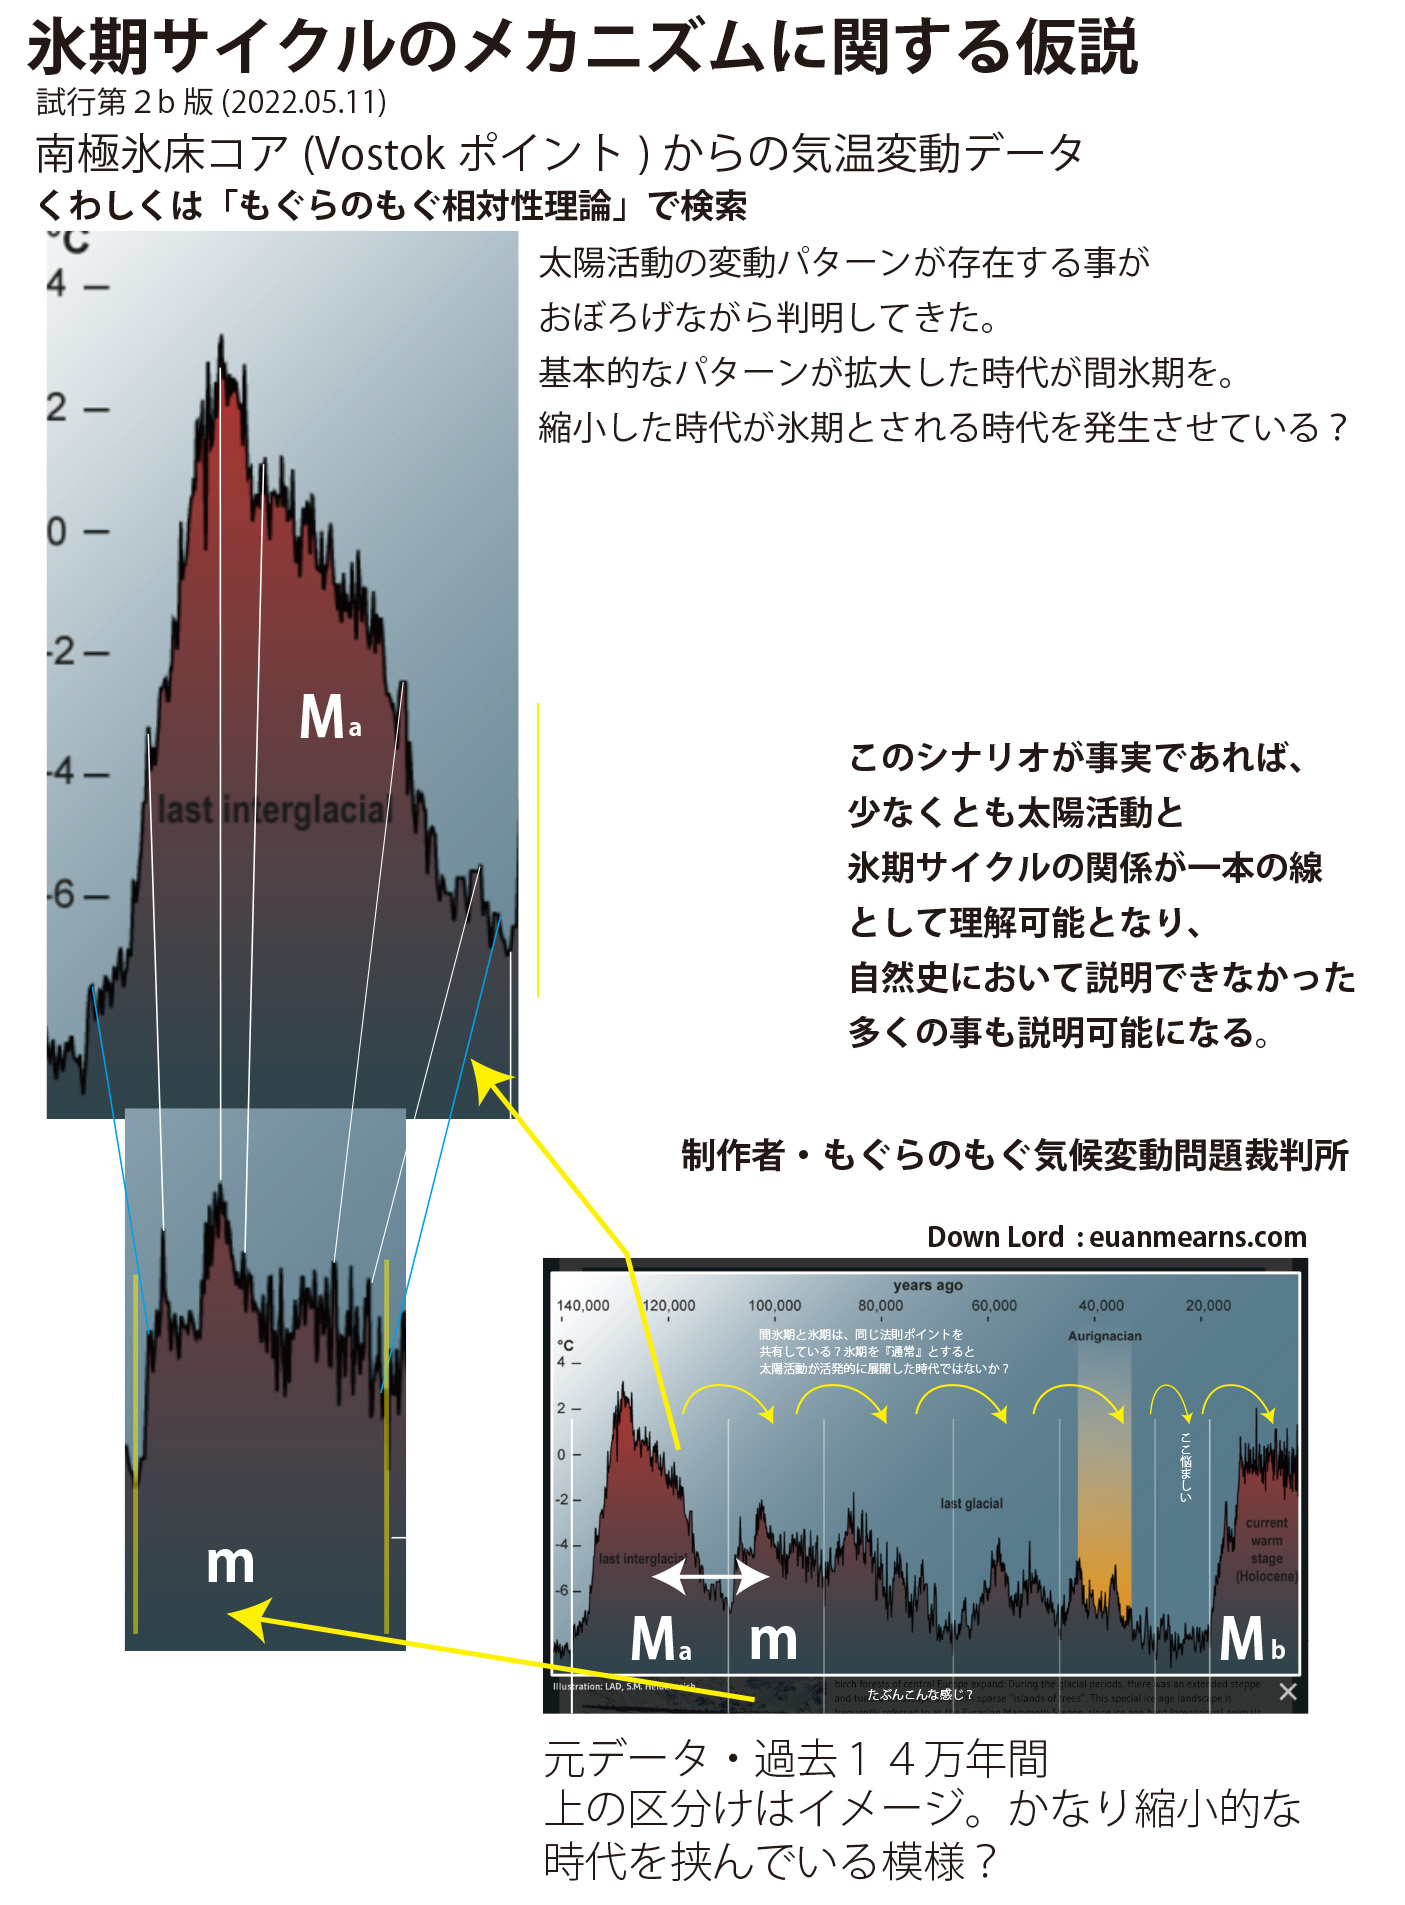
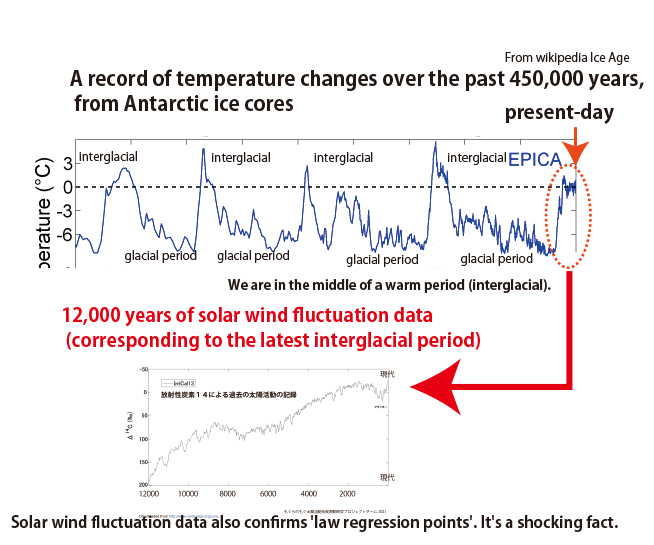
Temperature variation data from Antarctic ice cores at each drilling point. Last 450,000 years. This is the famous phenomenon called the glacial cycle.
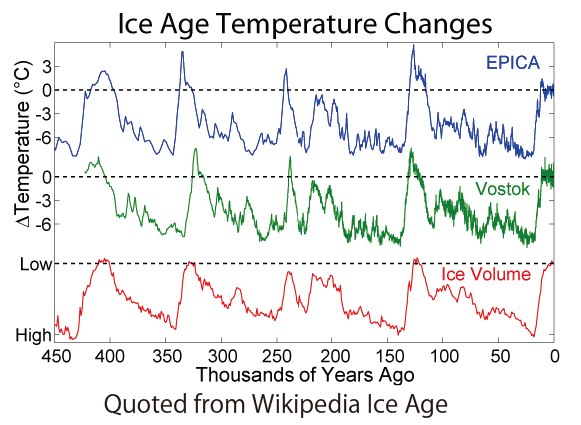
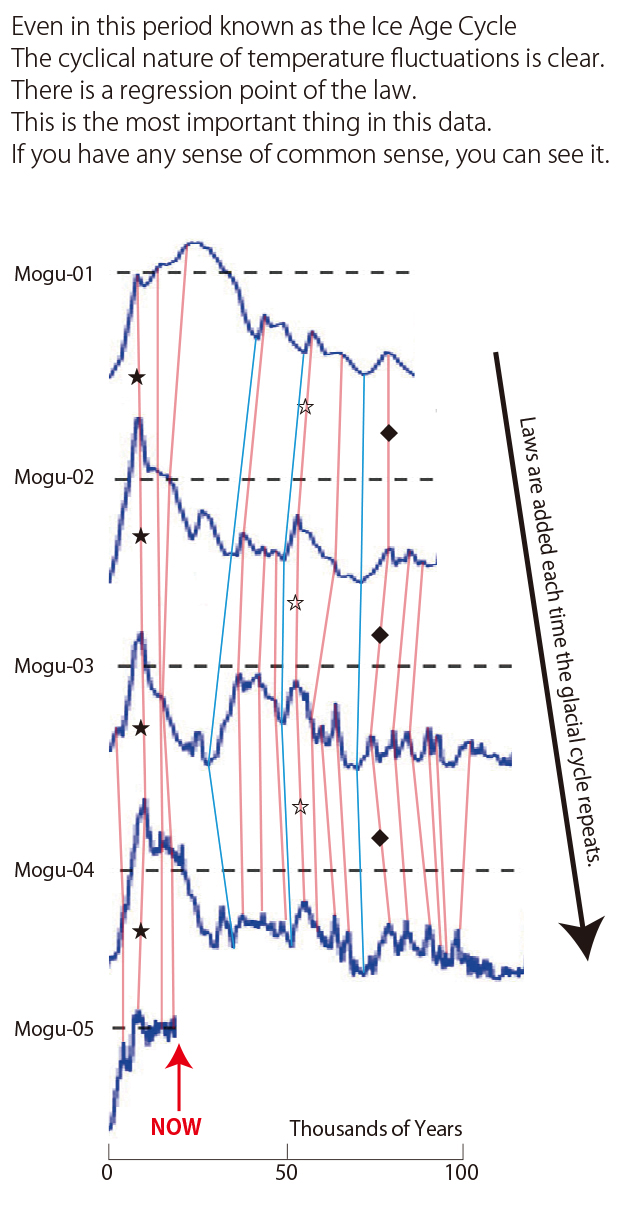
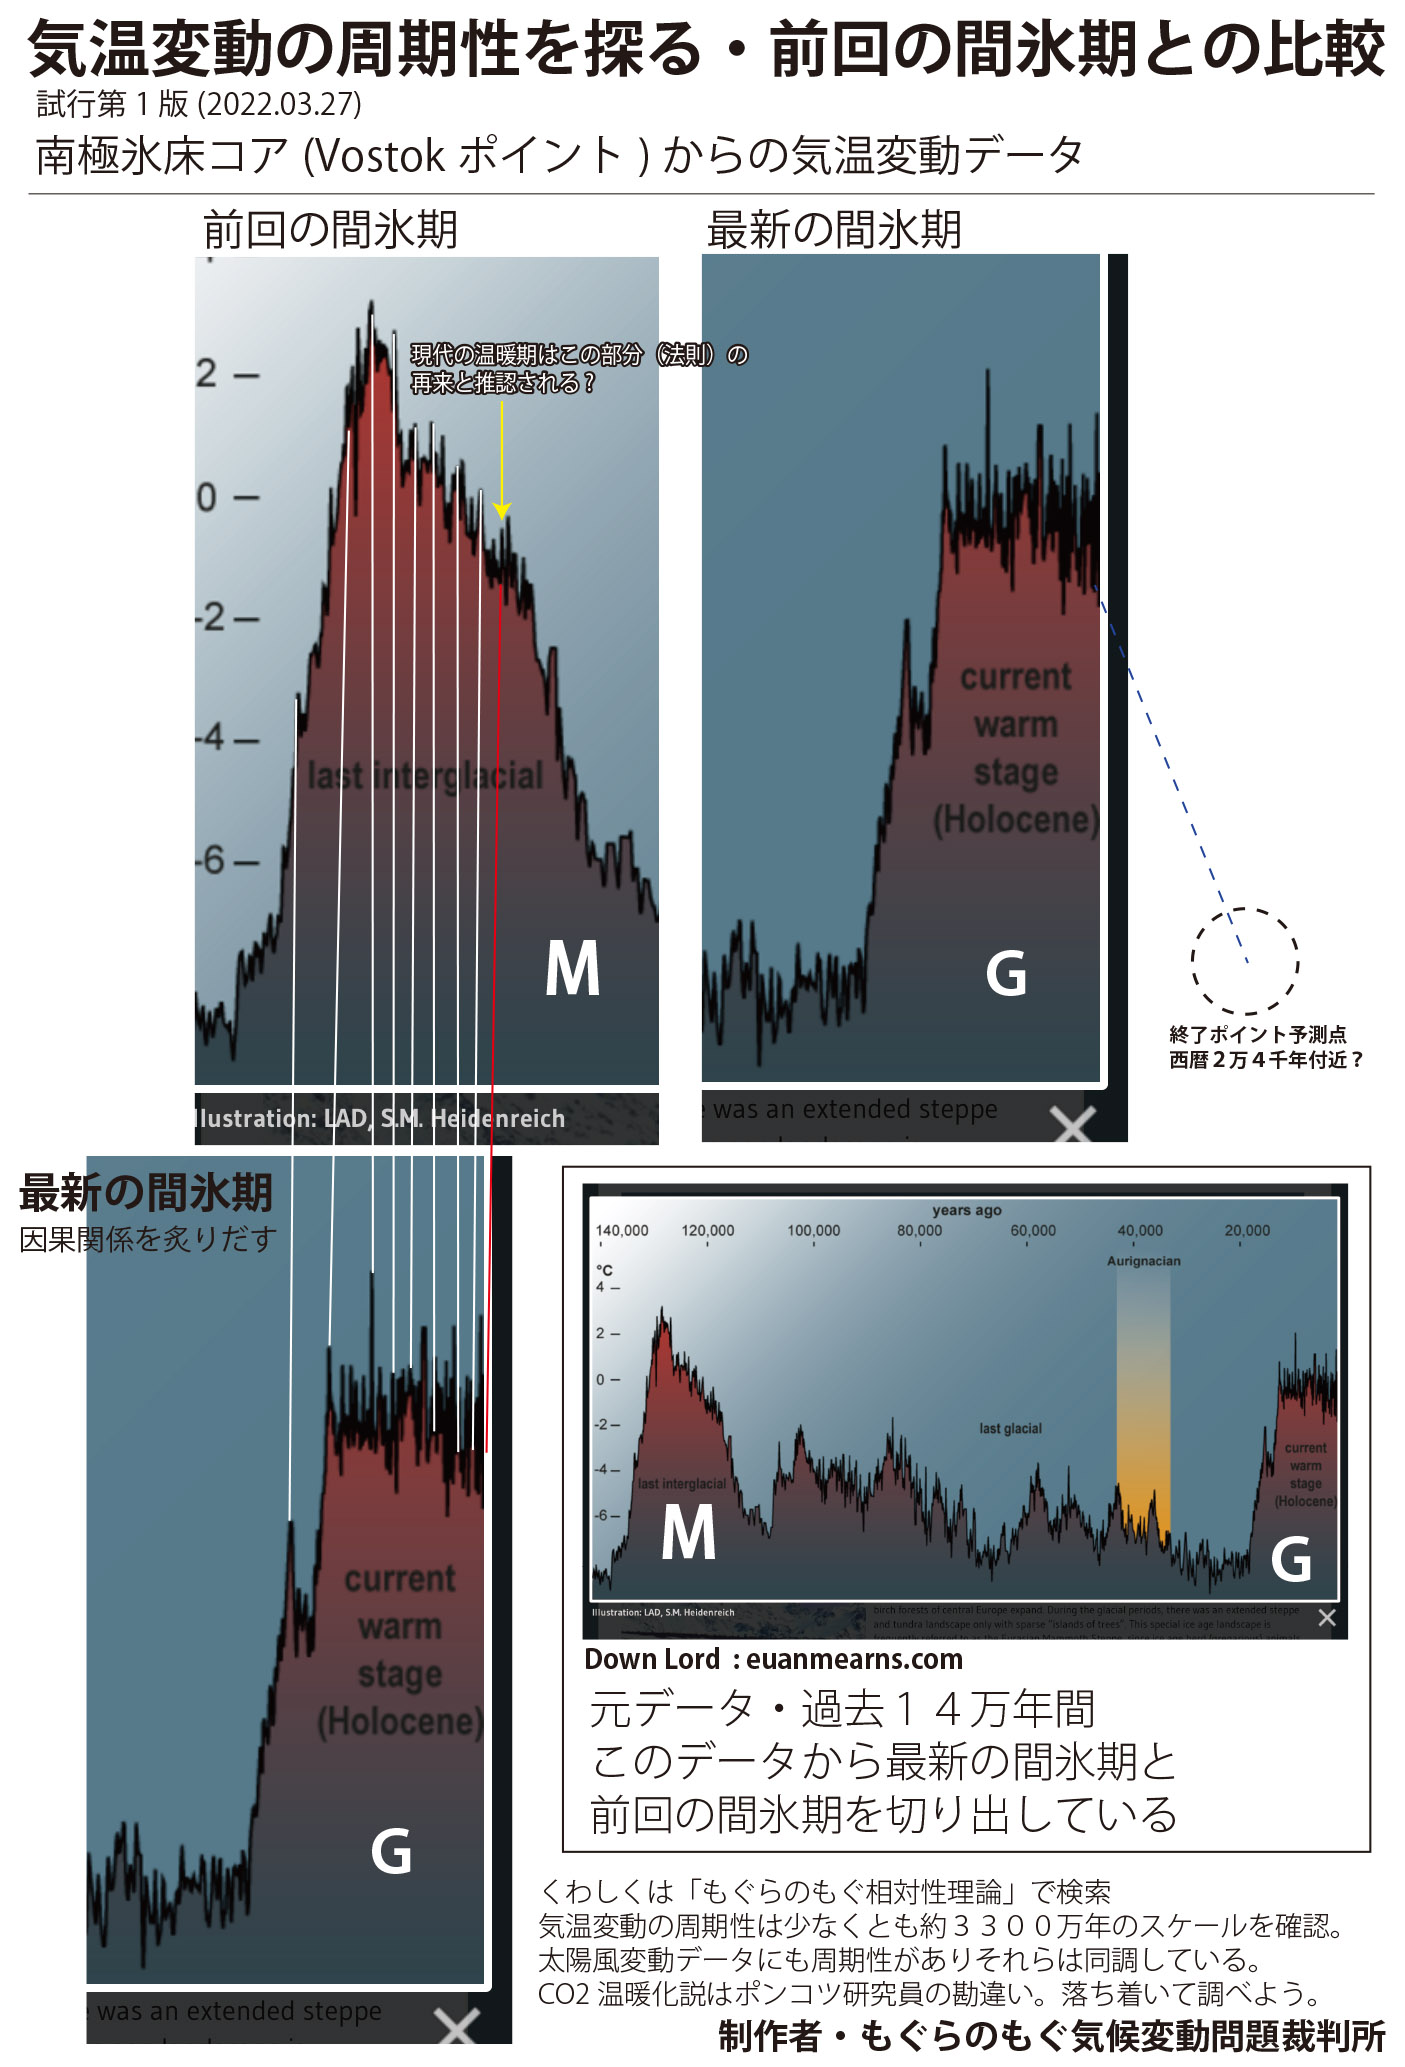
The same can be said here. Look for "law regression points" lay them out in parallel, and connect the similarities. With this simple process, we can see that there is a clear law and periodicity in the global temperature variation.
Don't just look at it in a daze. The first time we showed the world this simple fact was in 2019.
(IPCC presentations are always deficient in common sense. In our case, we always publish based on common sense. Whatever the case, you all need to wake up once again.)
Please excuse the back and forth order.
A
We do not have detailed data, so we cannot give a clear understanding, but we can find a "law regression point" at this scale as well.
New
Well ......
D
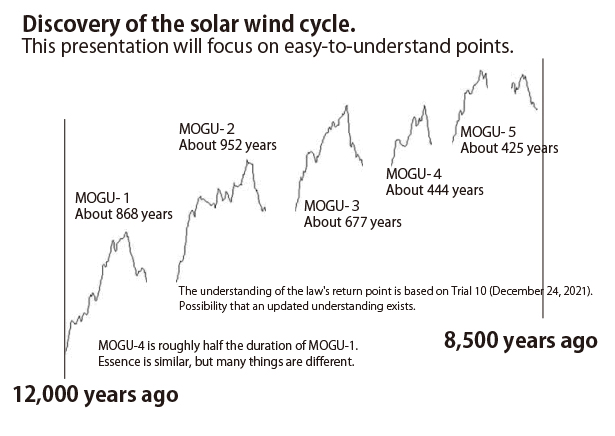
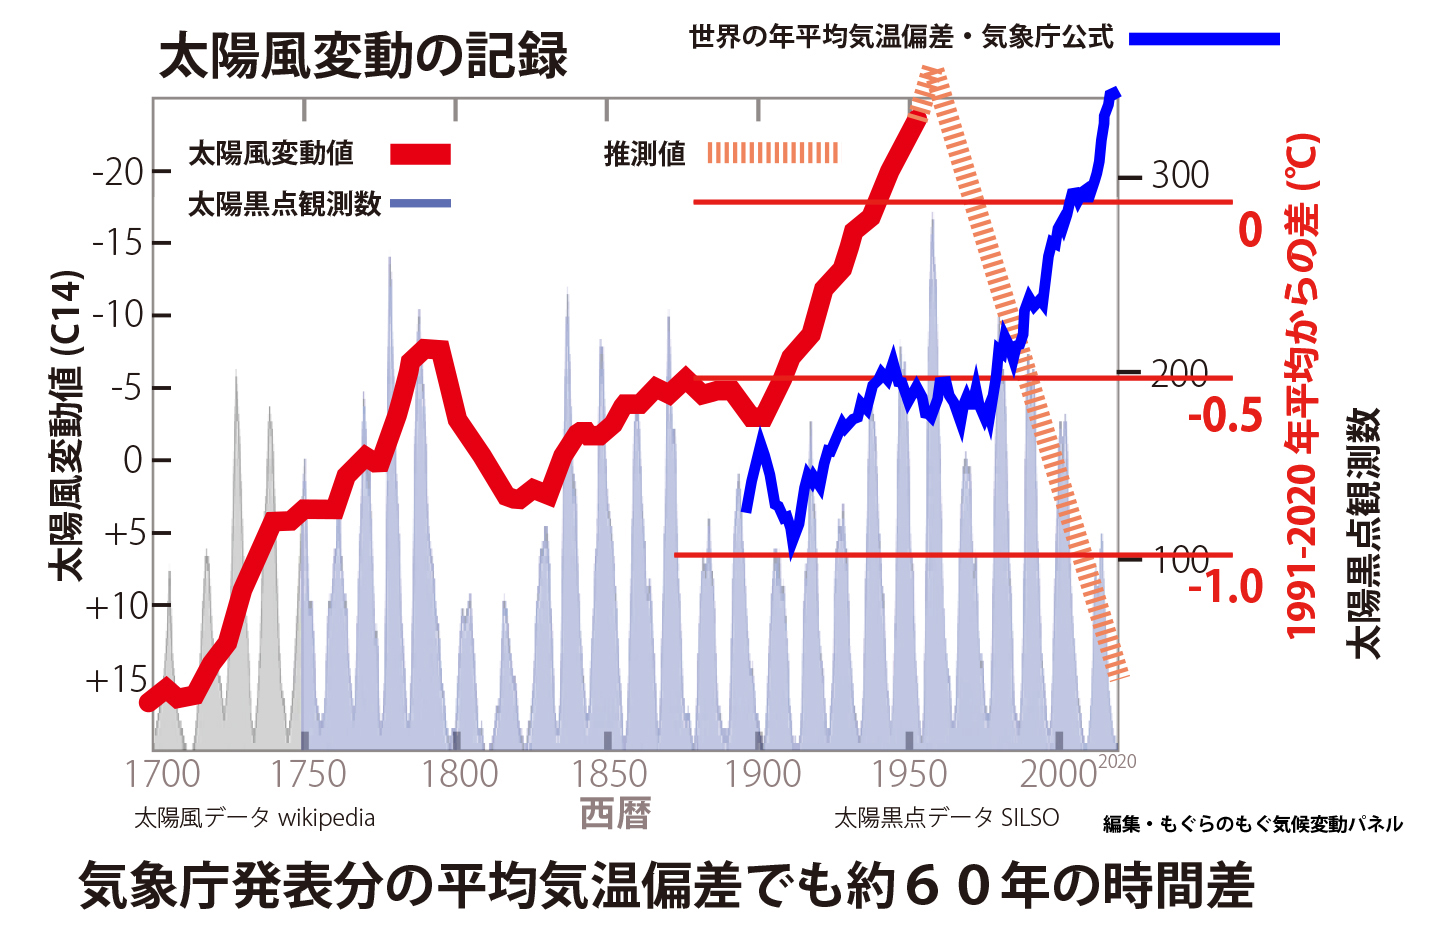
In the temperature fluctuation data, we found the regression point of the law. In the same way, we can also find the regression point of the law in the solar wind variation data.
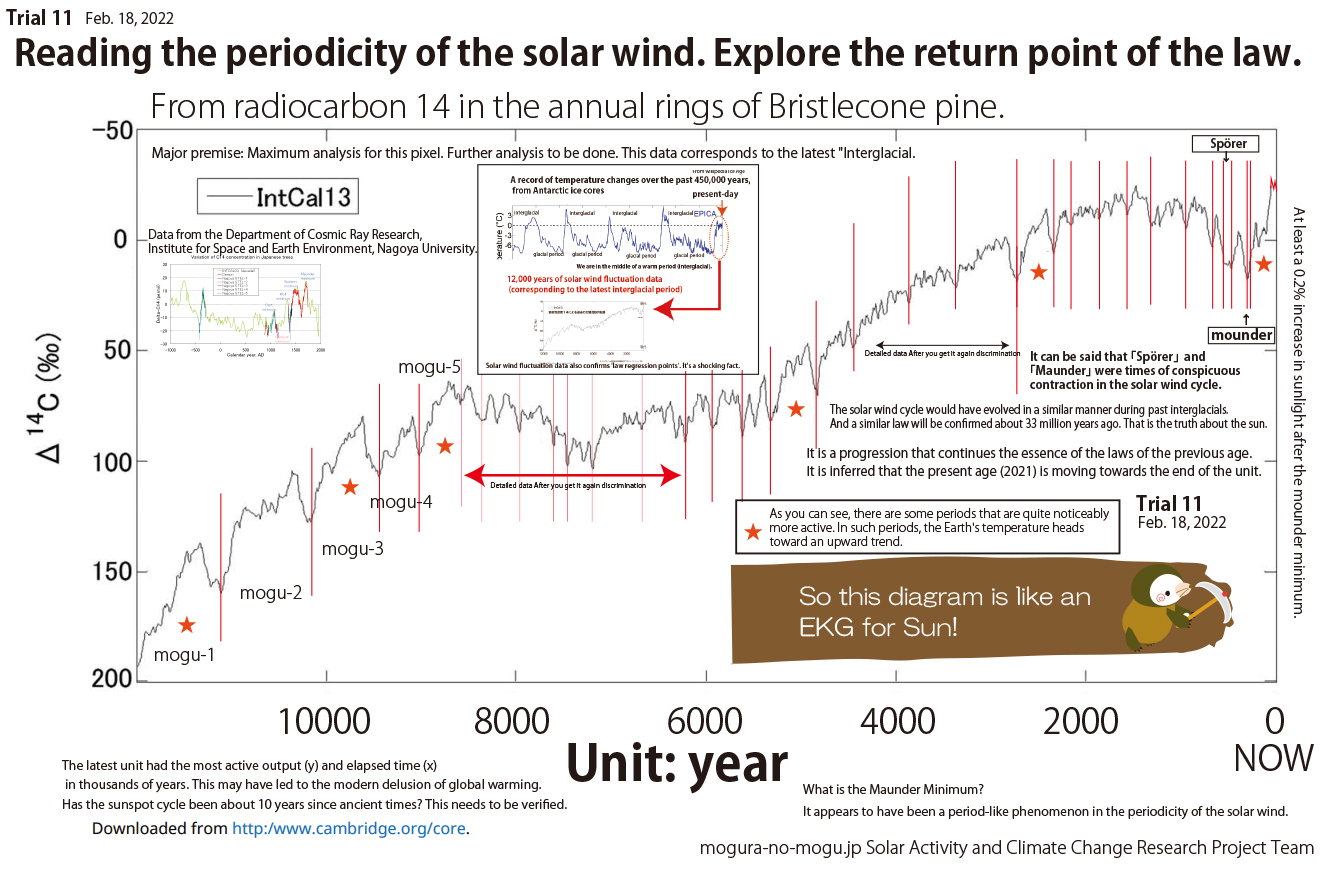

You just need to have a sense of common sense and interpret it honestly.

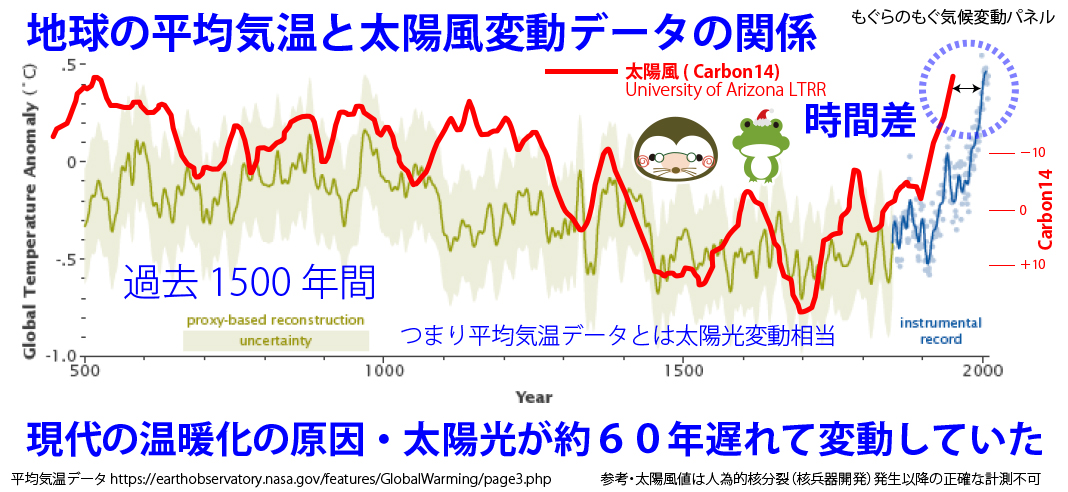
The solar wind cycle that started around the Maunder Minimum may have ended around 2020. We'll know more about that in a few years.
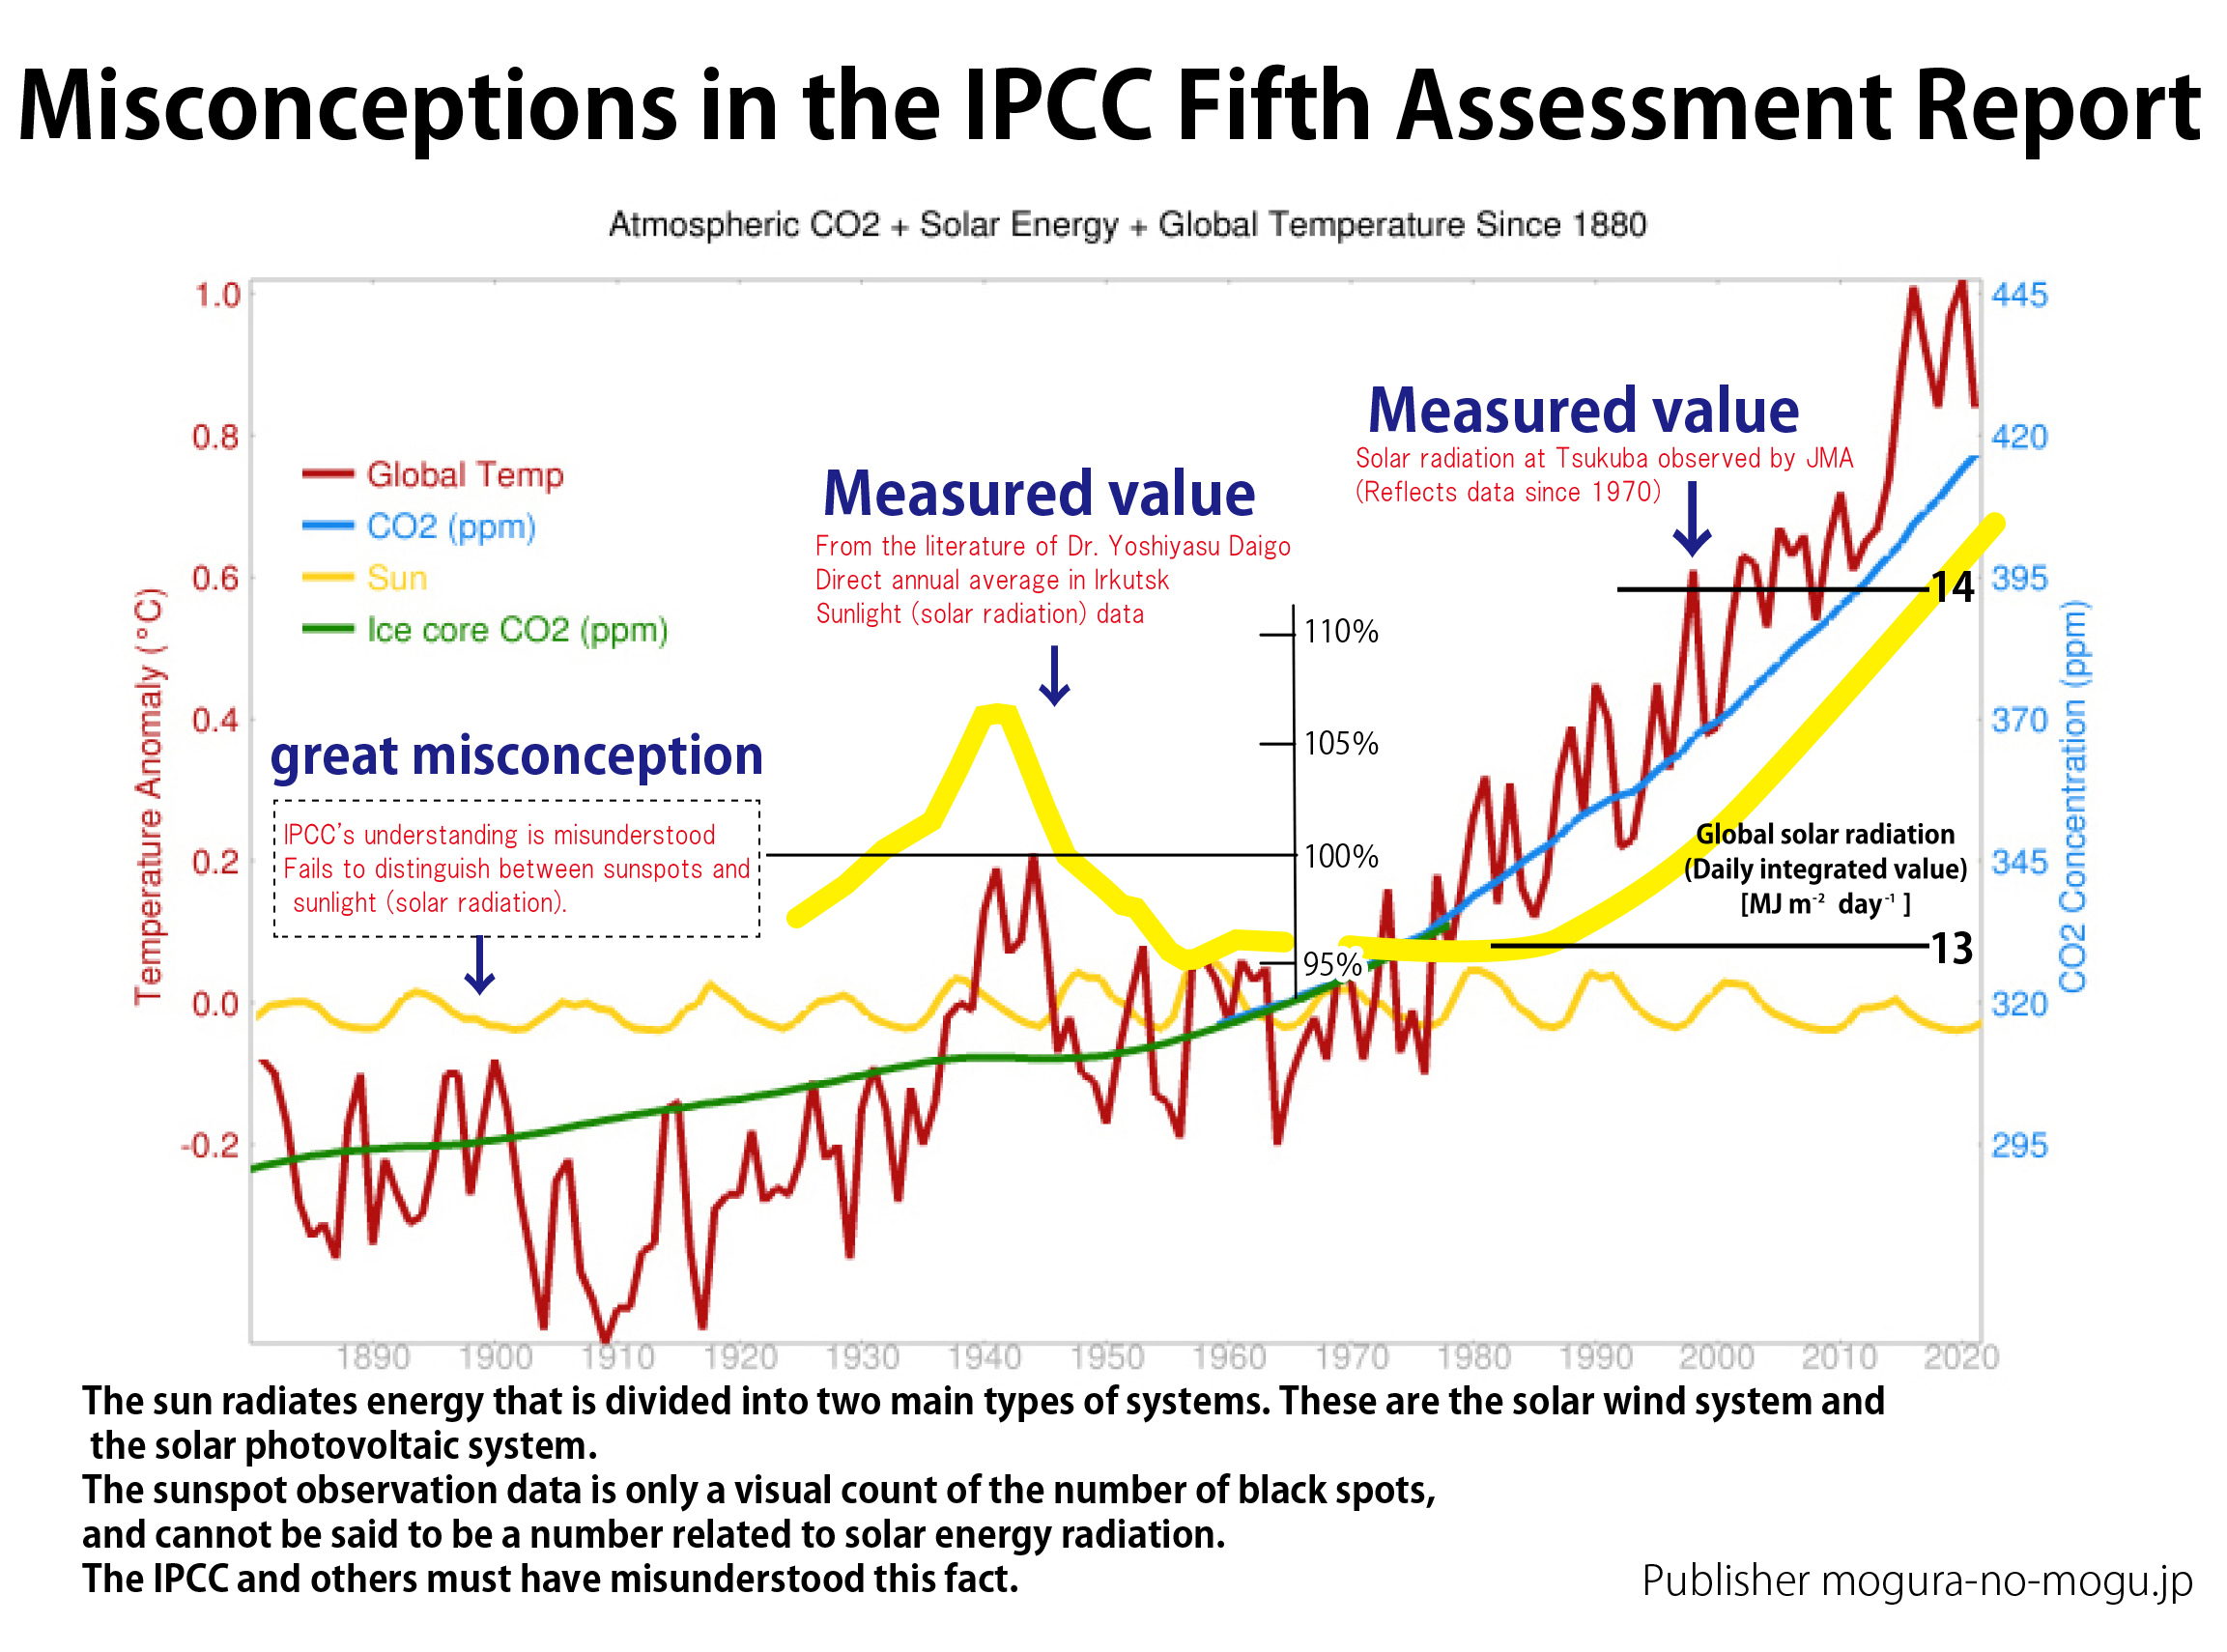
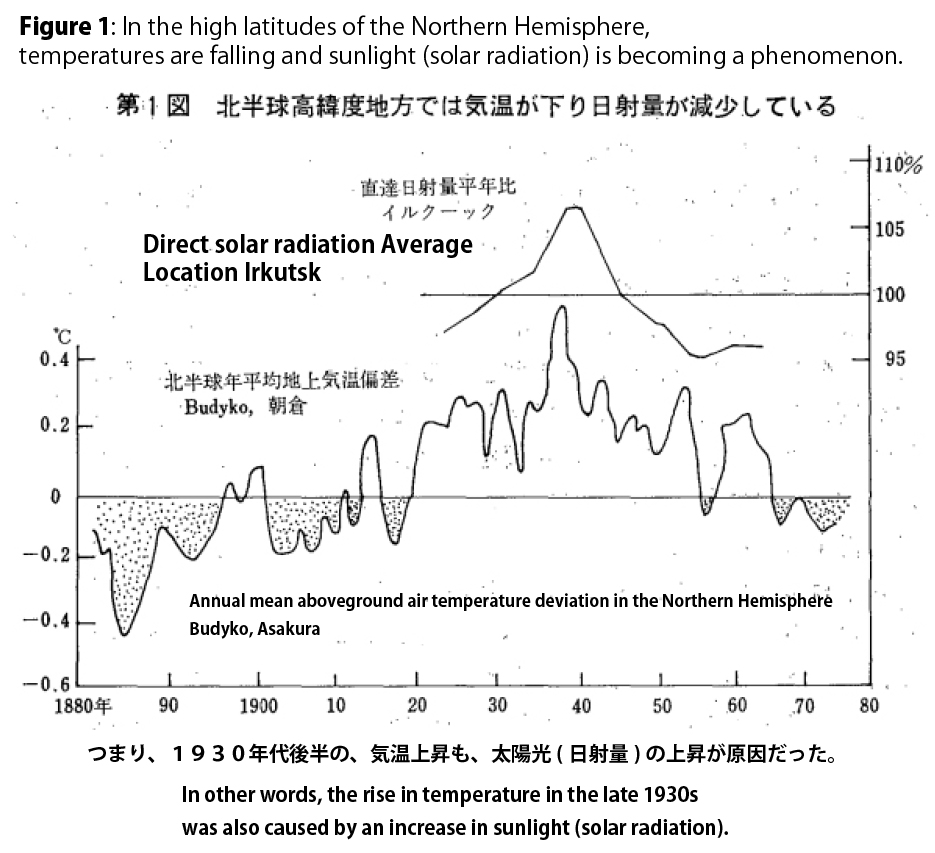
The solar wind cycle since the Maunder Minimum has been rising quite rapidly. And solar light was up about 0.2%. This is the reason for the modern warming. Wouldn't it be fair to say that we have known for tens of millions of years that the modern era would be a warm one?
Clear periodicity is observed in the A, B, C, and D data.
Well ......
Researchers of solar activity should not be surprised here.
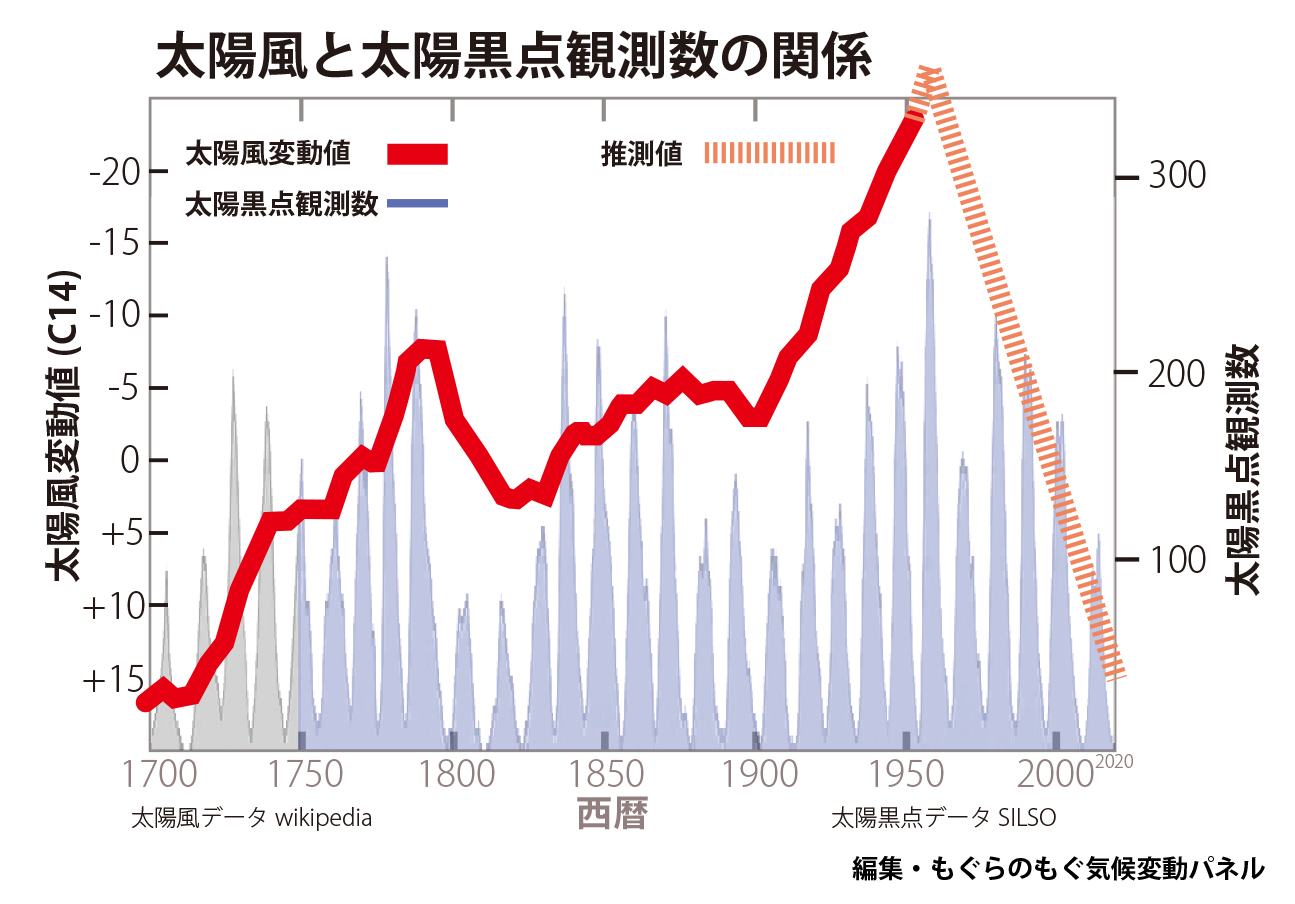
Here is a new discovery about sunspots.

There is first of all a variation in the solar wind cycle.
The sunspots are generated along with these fluctuations.
There is a master-slave relationship.
In other words, we have to realize that the occurrence of sunspots is not a simple repetition.
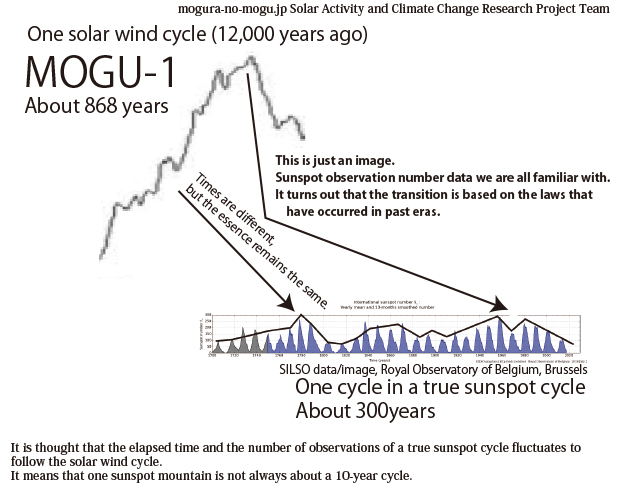
This is just an image.
Sunspot observation number data we are all familiar with.
It turns out that the transition is based on the laws that have occurred in past eras.
In modern science, sunspots are known to occur in mountains of about 10 years.
And it is often explained that there have been 10-year mountains since prehistoric times.
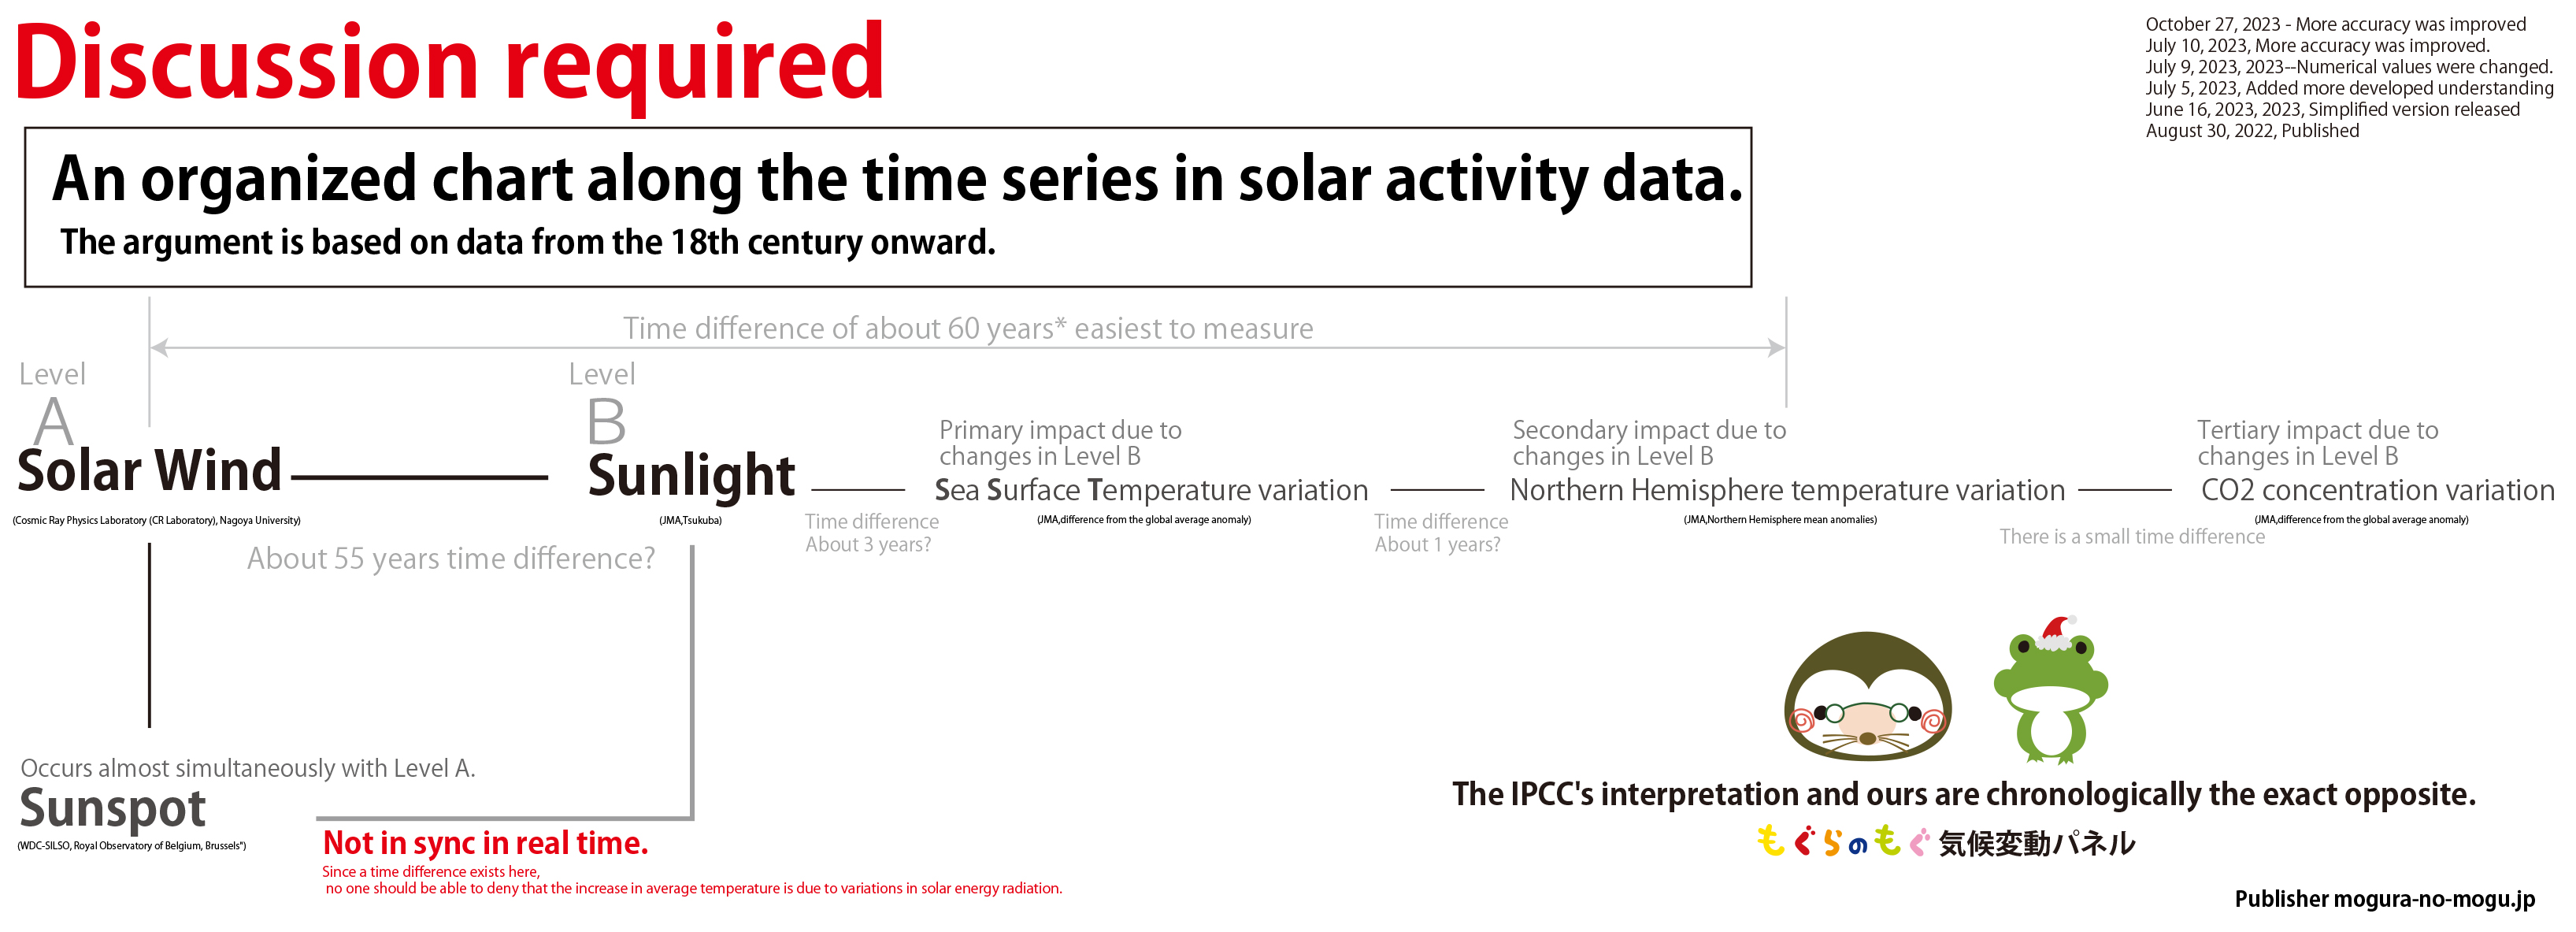
However, in our systematic and common sense research, we have found that the solar wind cycle and the sunspot cycle are a set and have a master-subordinate relationship.
As a result, we also found out that the sunspot cycle is not a ten-year mountain that continues uninterruptedly.
Solar activity and climate change occur in accordance with the cyclical nature of solar activity.
Periodicity is easy to exploit once you realize it. Therefore, in the near future, we will be able to roughly predict future temperature changes. Not only in a few hundred years, but also in tens of millions of years.
The laws of the solar wind cycle that we have discovered should be confirmed during the interglacial period, which occurred 120,000 years ago. It should also be confirmed about 33 million years ago.
Compared to the laws of the past, the laws of the new era will have changed to some extent. However, we have to realize that the prototype is the same.
The facts presented here will open many new doors.
Aren't the IPCC and others too incompetent? Aren't they a bunch of fools?
Their arguments are always inconsistent. Perhaps they should undergo psychological testing.
The Japanese page provides a more detailed explanation.
https://mogura-no-mogu.blog.ss-blog.jp/2024-03-06-mogu-riron
The presentation in English has been delayed. I hope you will look forward to it.
That's all for today.
Thank you very much for your access.
To all those who have read to the end.
Reward Information

The data above is the observed data since 1600.
As for us, this is where we are focusing our attention.
Given this fact, let's consider this.....
If we evaluate solar activity on a scale of hundreds of years, we get.....
There are times of expansion and times of contraction. It can be expressed that way.
The period considered to be the Maunder is considered to be a period of extreme contraction.
The period that lasted from about 1700 to 2020 is considered to be an era of expansion.
Analysis of the laws of the solar wind cycle over the past 12,000 years has shown
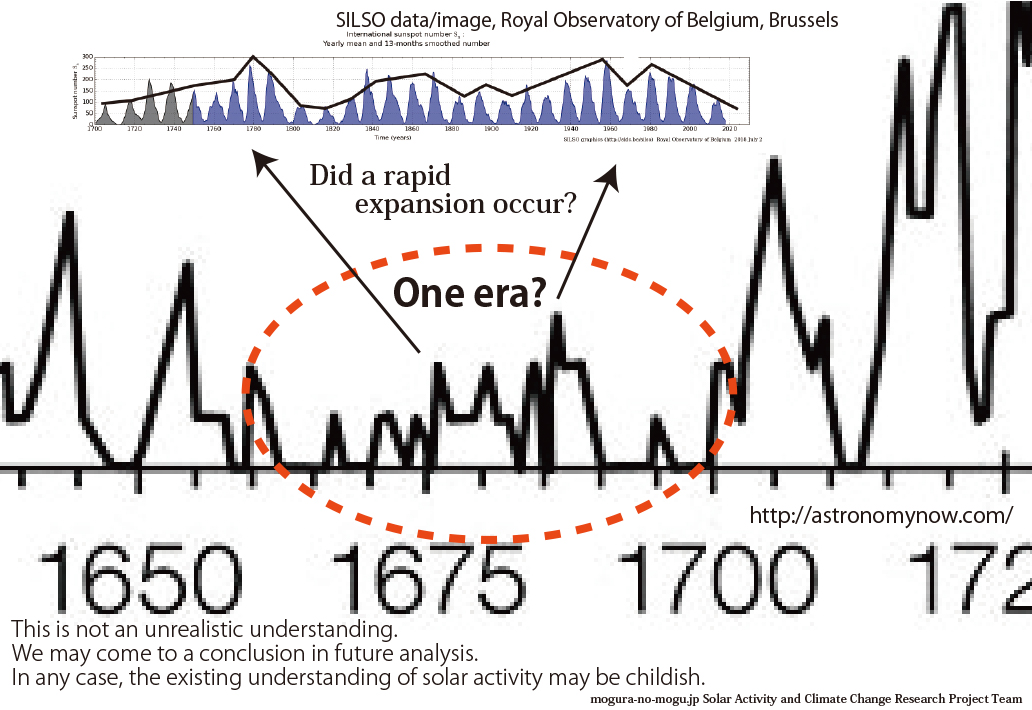
There is no evidence of a change from small activity to large activity or vice versa in the middle of an era.
This fact gives us reason to believe that the very small group from about 1665 to 1685 is one (fairly small) era of the solar wind cycle.
It is a fairly small group, but it is moving in a unified scenario.
New
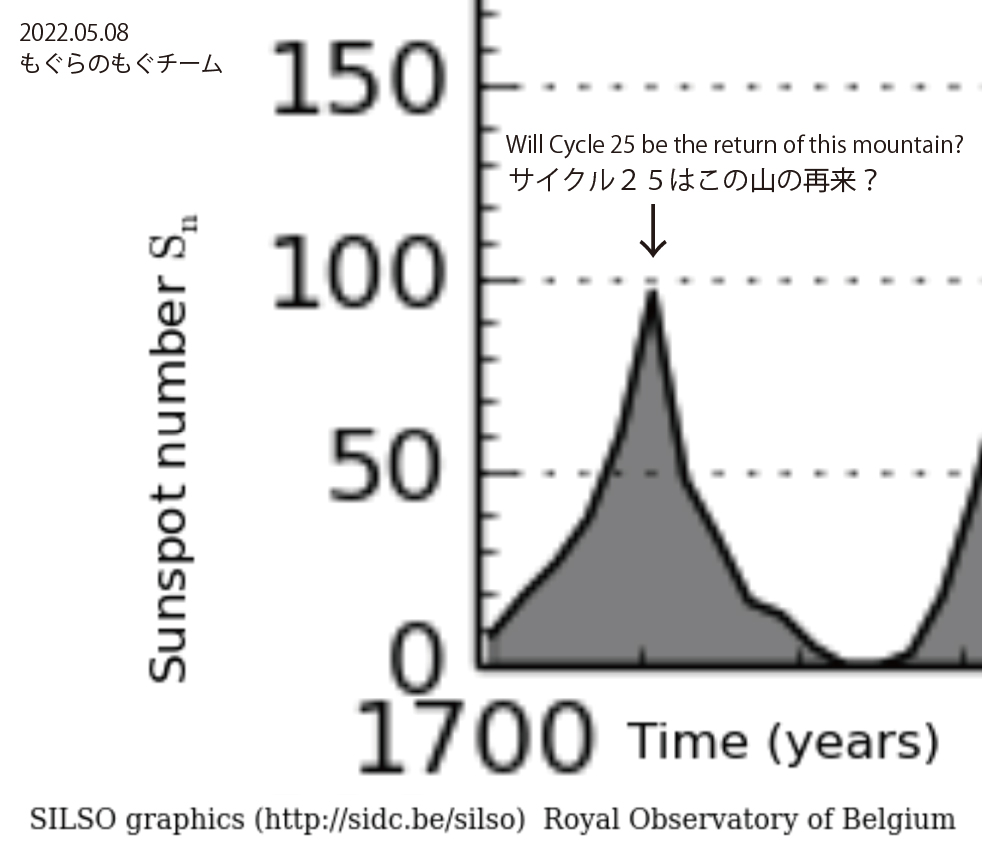
Cycle25 = 1st ?
If this understanding is true, then humanity has a complete set of data for two eras in a true sunspot cycle. (If cycle 25 means the beginning of a new era).
This is by no means a wealth of data, but it will prove many facts.
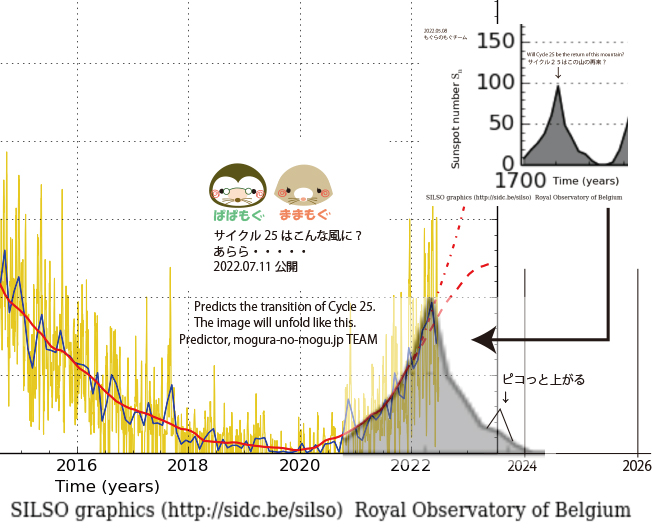
Further study of this fact will allow us to predict with a high degree of accuracy the evolution of an era (in the solar wind cycle) after 2020 AD.
Based on the elapsed time and peaks in sunspot numbers for sunspot cycle 25, as currently defined by mankind, and cycle 26, as it will occur in the future, we will be able to infer scenarios for changes in solar activity and average temperatures in the coming decades and centuries.
This is what it means to be aware of periodicity and laws. Humanity will be able to move forward to another level of scientific understanding.
Don't get caught up in stereotypes. This is a discovery that will leave us with such a lesson.


NEW
Edited as one file.
New 2022
More
https://mogura-no-mogu.blog.ss-blog.jp/2022-12-08-time-difference
https://mogura-no-mogu.blog.ss-blog.jp/2024-03-29-for-noaa-gov
2024
2022-02-13 14:14
nice!(10)
コメント(0)


コメント 0